WHEN NOISE LOWERS THE LOSS
Rethinking Likelihood-based Evaluation in Music LLMs
Read the PaperAbout this Work
We discovered that injecting noise into music often lowers the loss in Music LLMs, making absolute loss unreliable for evaluation. Instead, the shape of the loss curve—its peaks and phases—provides more meaningful signals for evaluation. Here are supplementary materials and experiments to support this effect.
Audio Demos & Loss Difference Analysis
When noise is injected, the model's loss first spikes, showing it detects inconsistency. But almost immediately the loss drops and stays low.
X-axis: tokens 200–750; noise injects at token 250 (at 5 Seconds) and lasts for 100 tokens (2 Seconds). Loss difference stays ~0 before 200, then changes. Definition: Loss(music + perturb) − Loss(original).
OOD Datasets - Beethoven_010
Original (Loss: 4.00)
Noise Injected (Loss: 3.80)

Figure 1-1 Loss Difference.
OOD Datasets - Chopin_073
Original (Loss: 3.46)
Noise injected (Loss: 3.28)
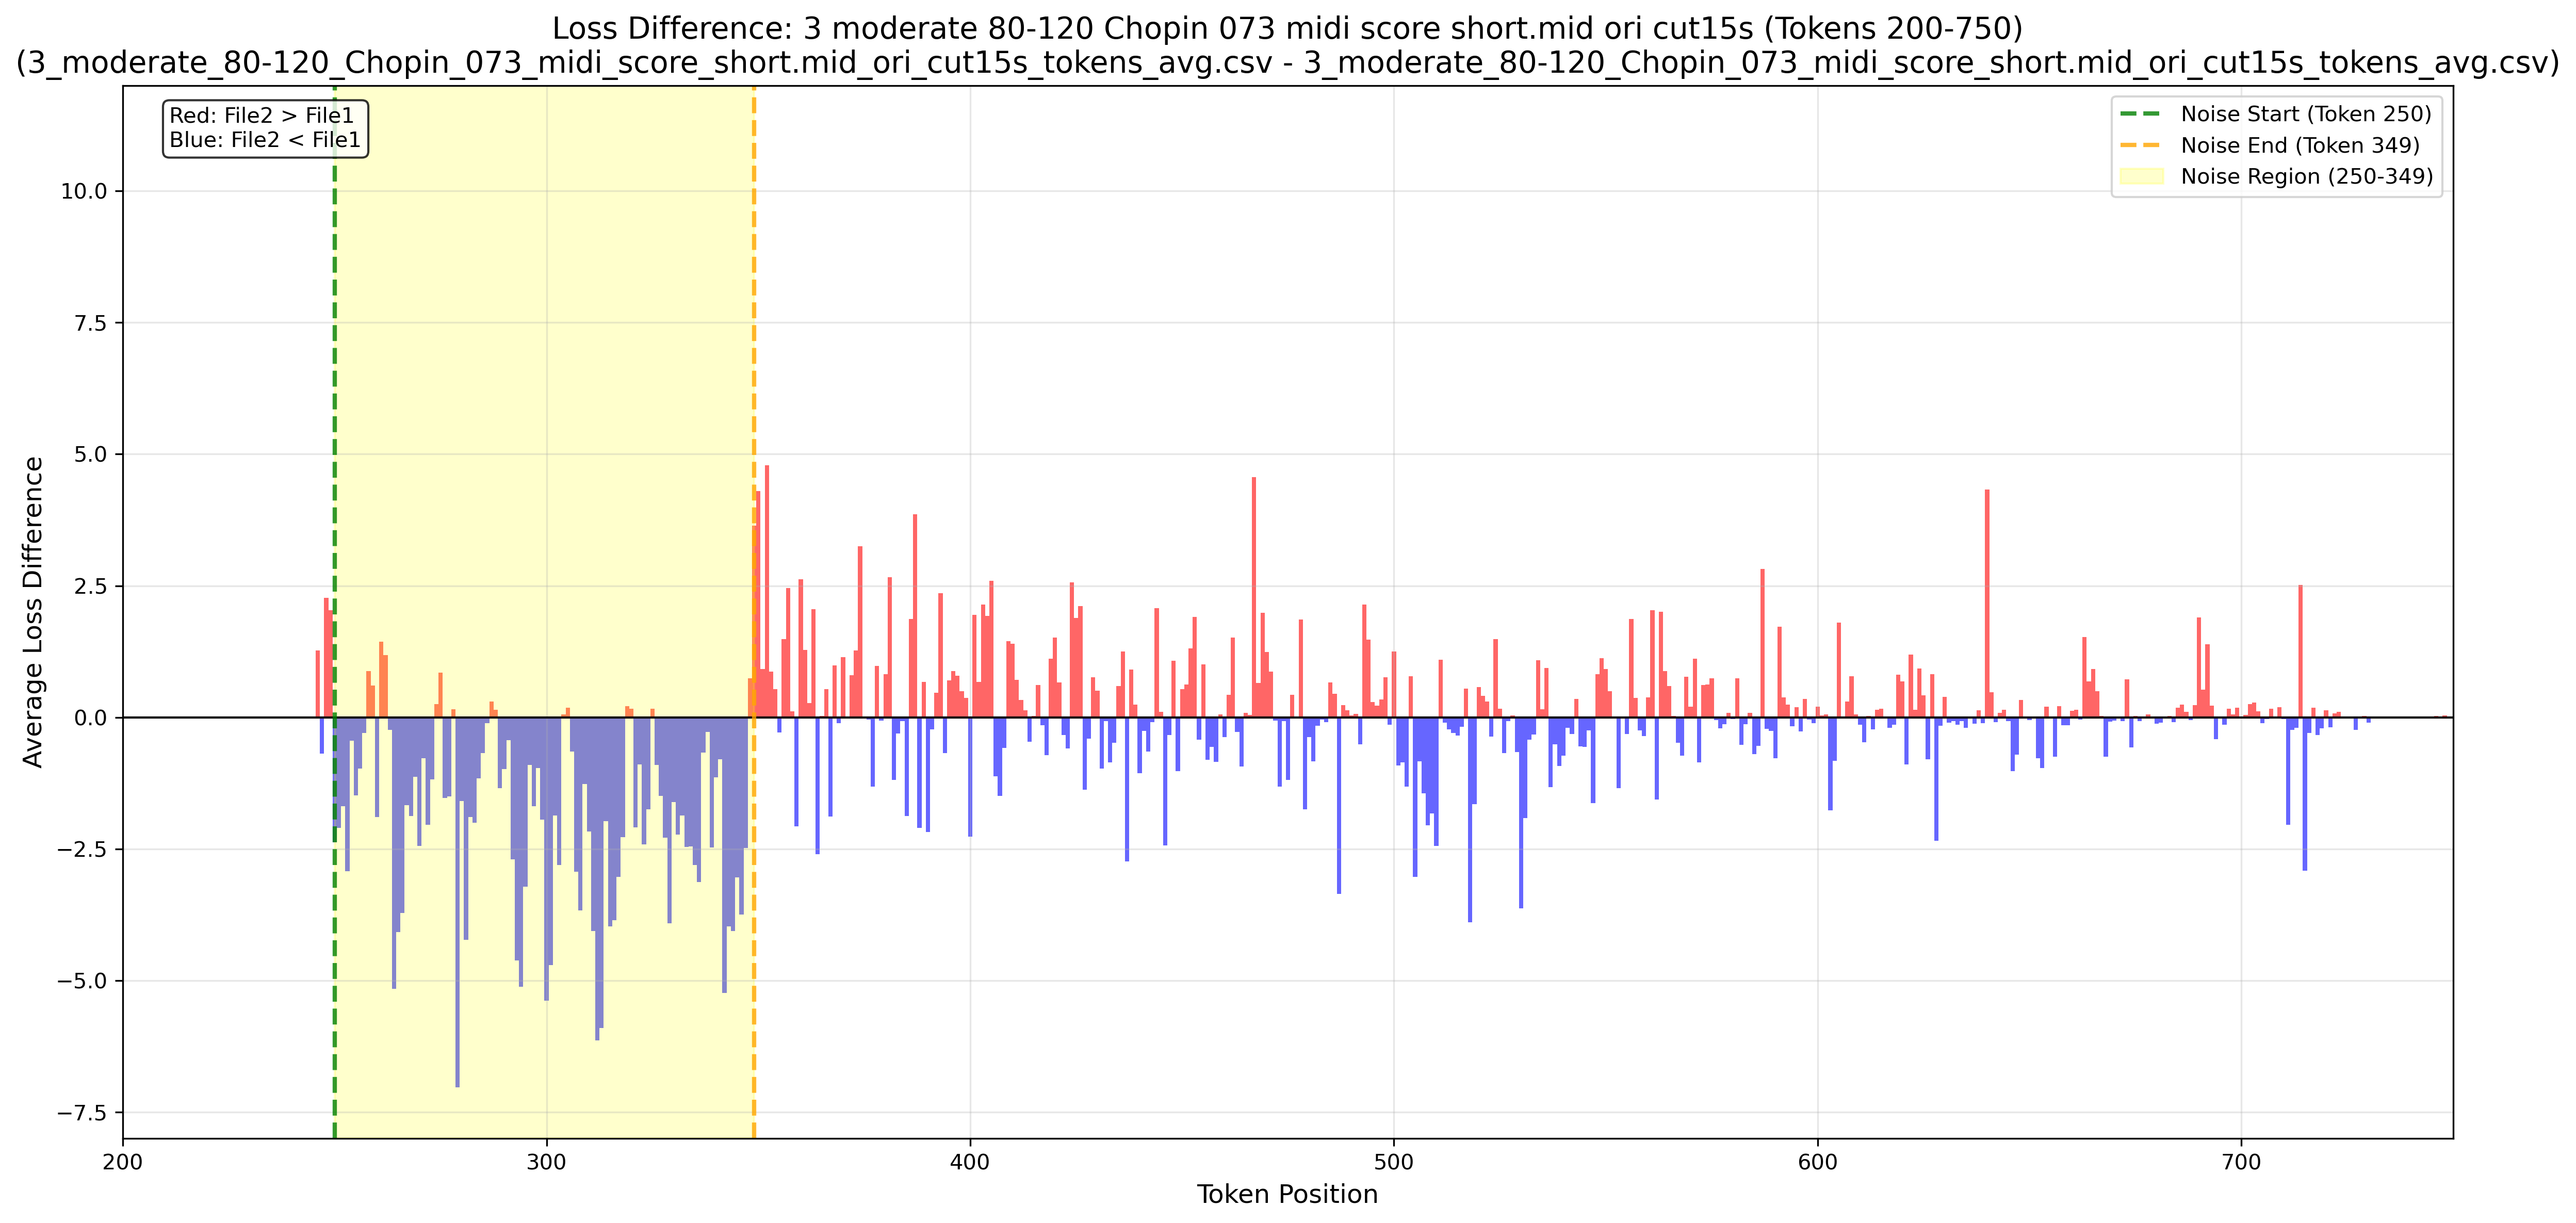
Figure 1-2 Loss Difference.
OOD Datasets - Schubert_062
Original (Loss: 4.49)
Noise injected (Loss: 4.27)
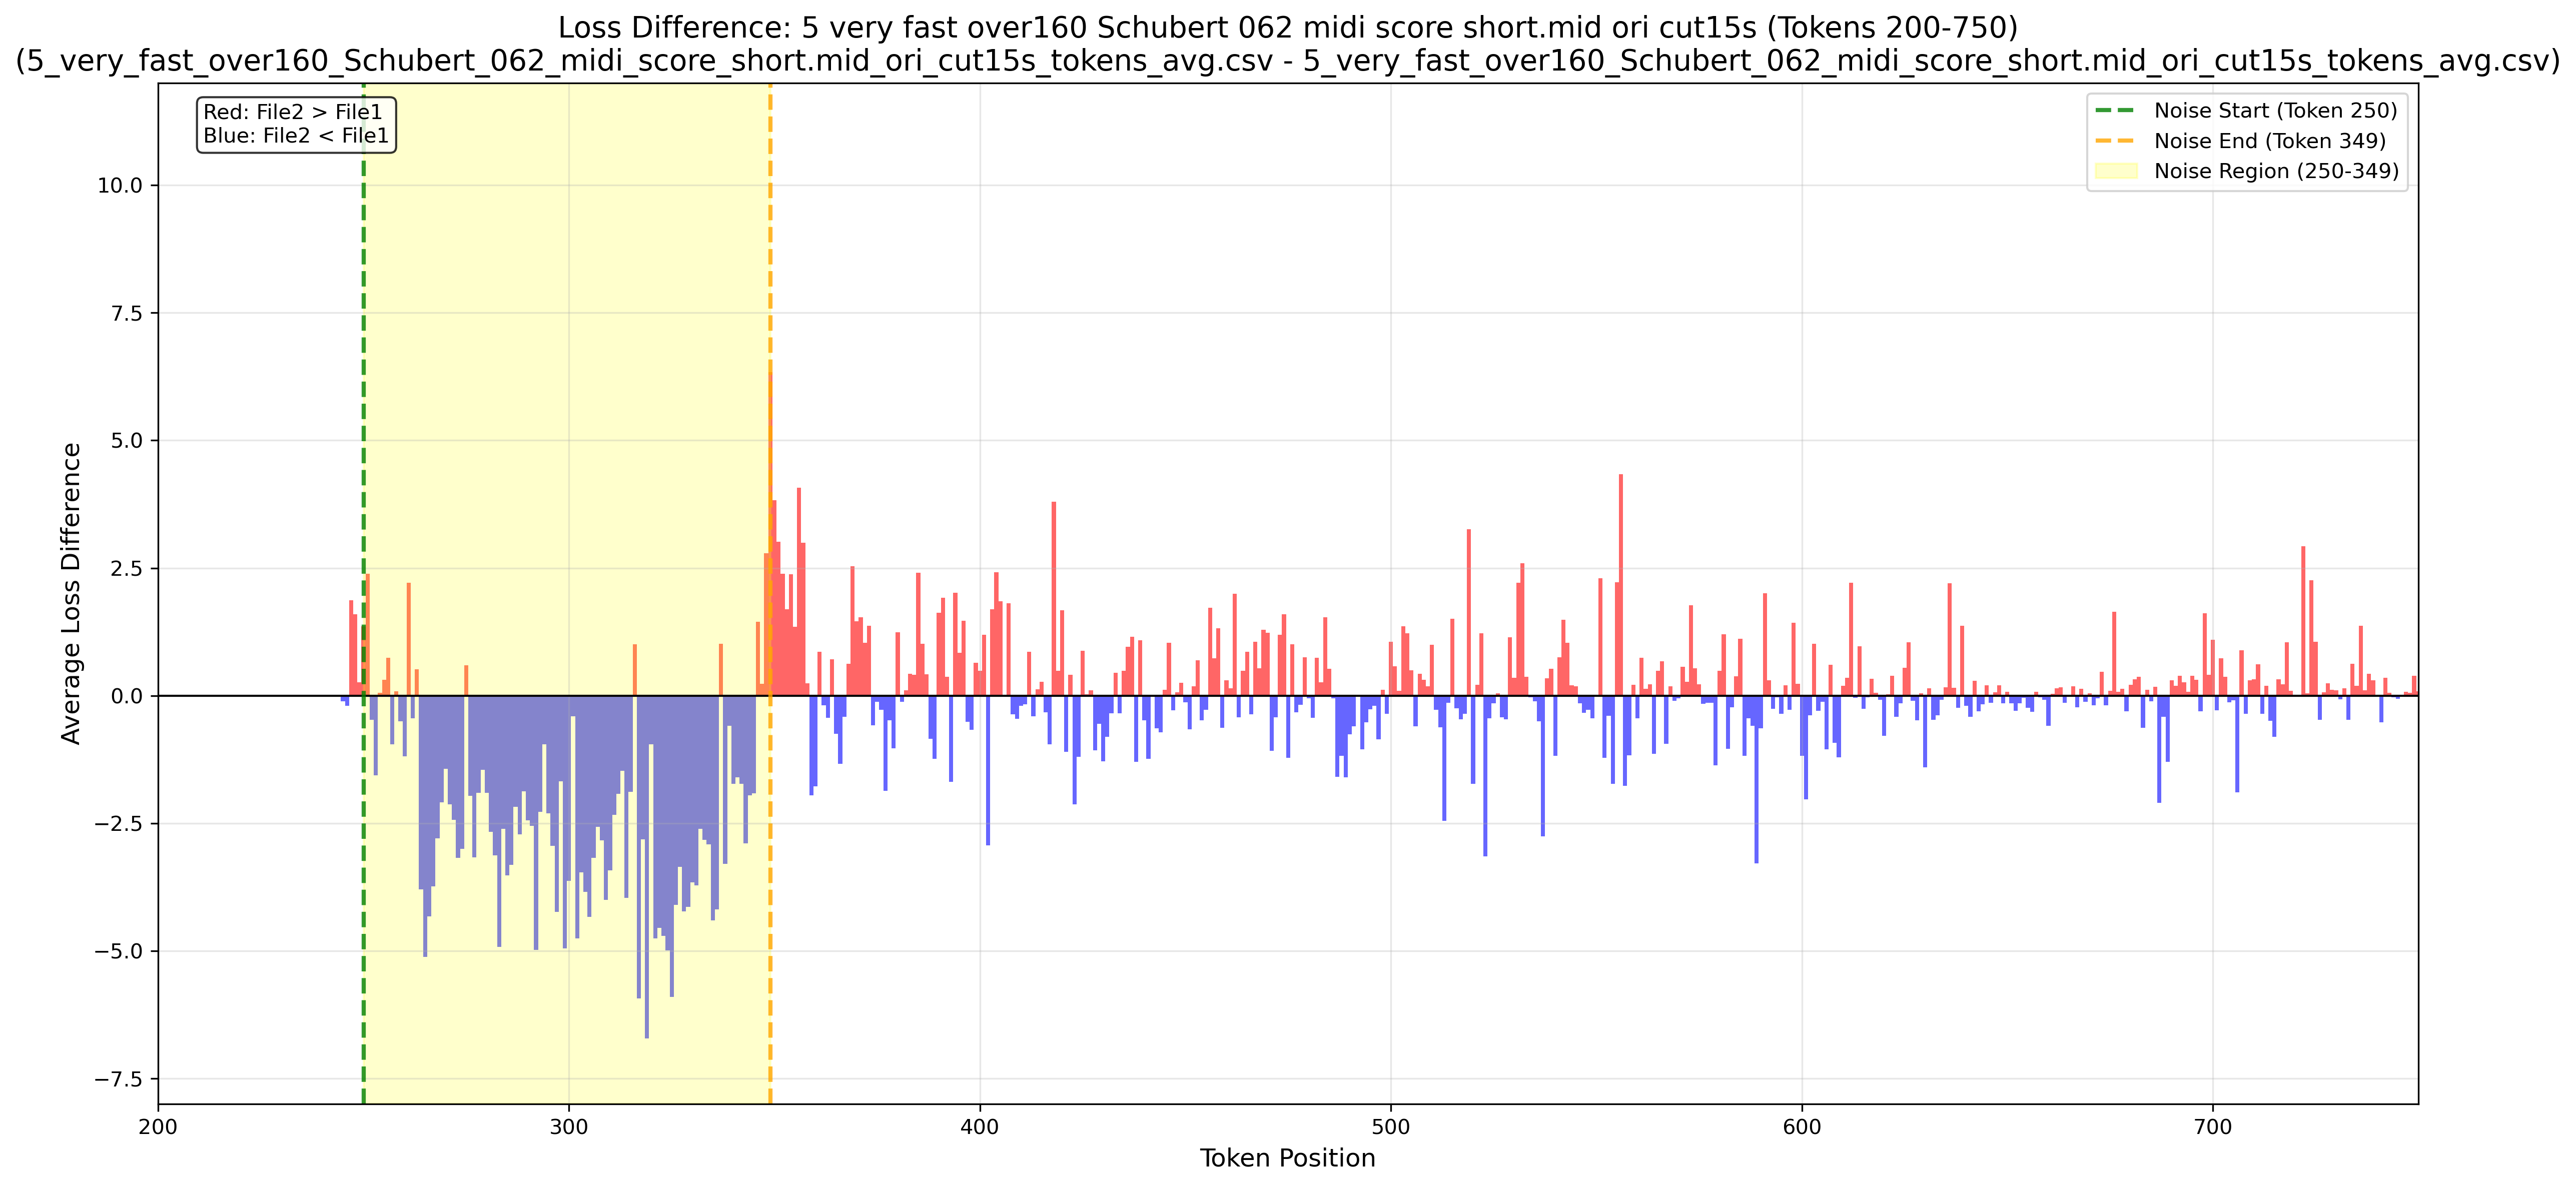
Figure 1-3 Loss Difference.
Generated Datasets - Topk = 250 - Sample 004
Original (Loss: 6.15)
Noise injected (Loss: 5.89)
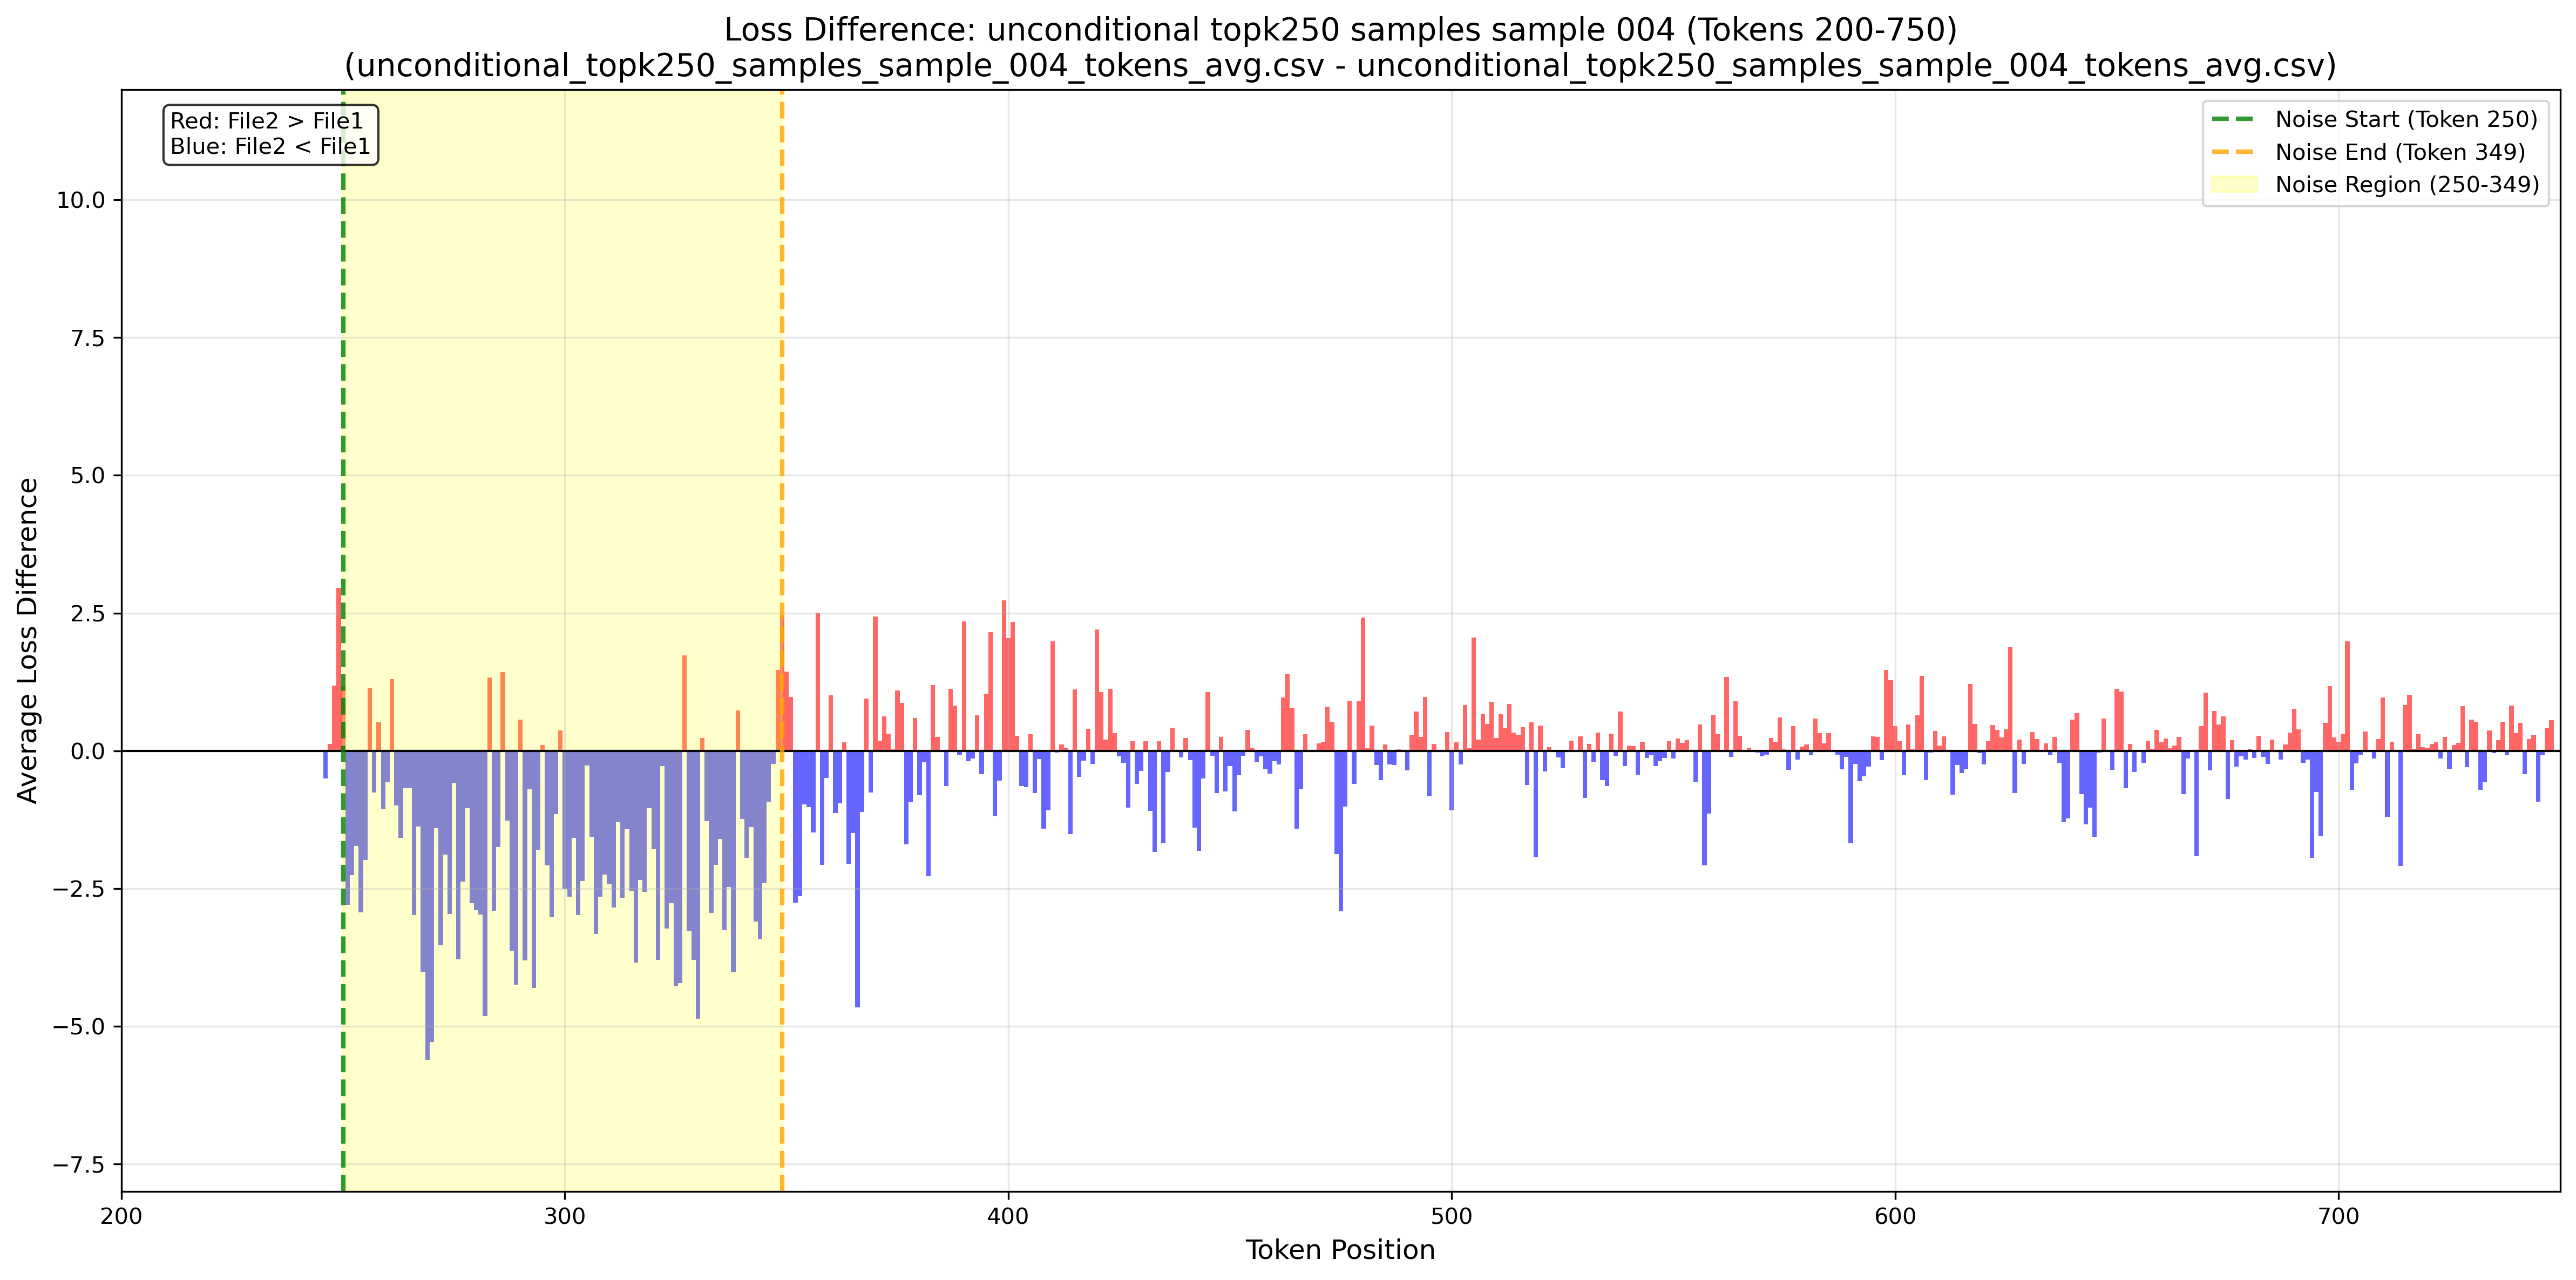
Figure 1-4 Loss Difference.
Generated Datasets - Topk = 250 - Sample 005
Original (Loss: 6.18)
Noise injected (Loss: 5.86)
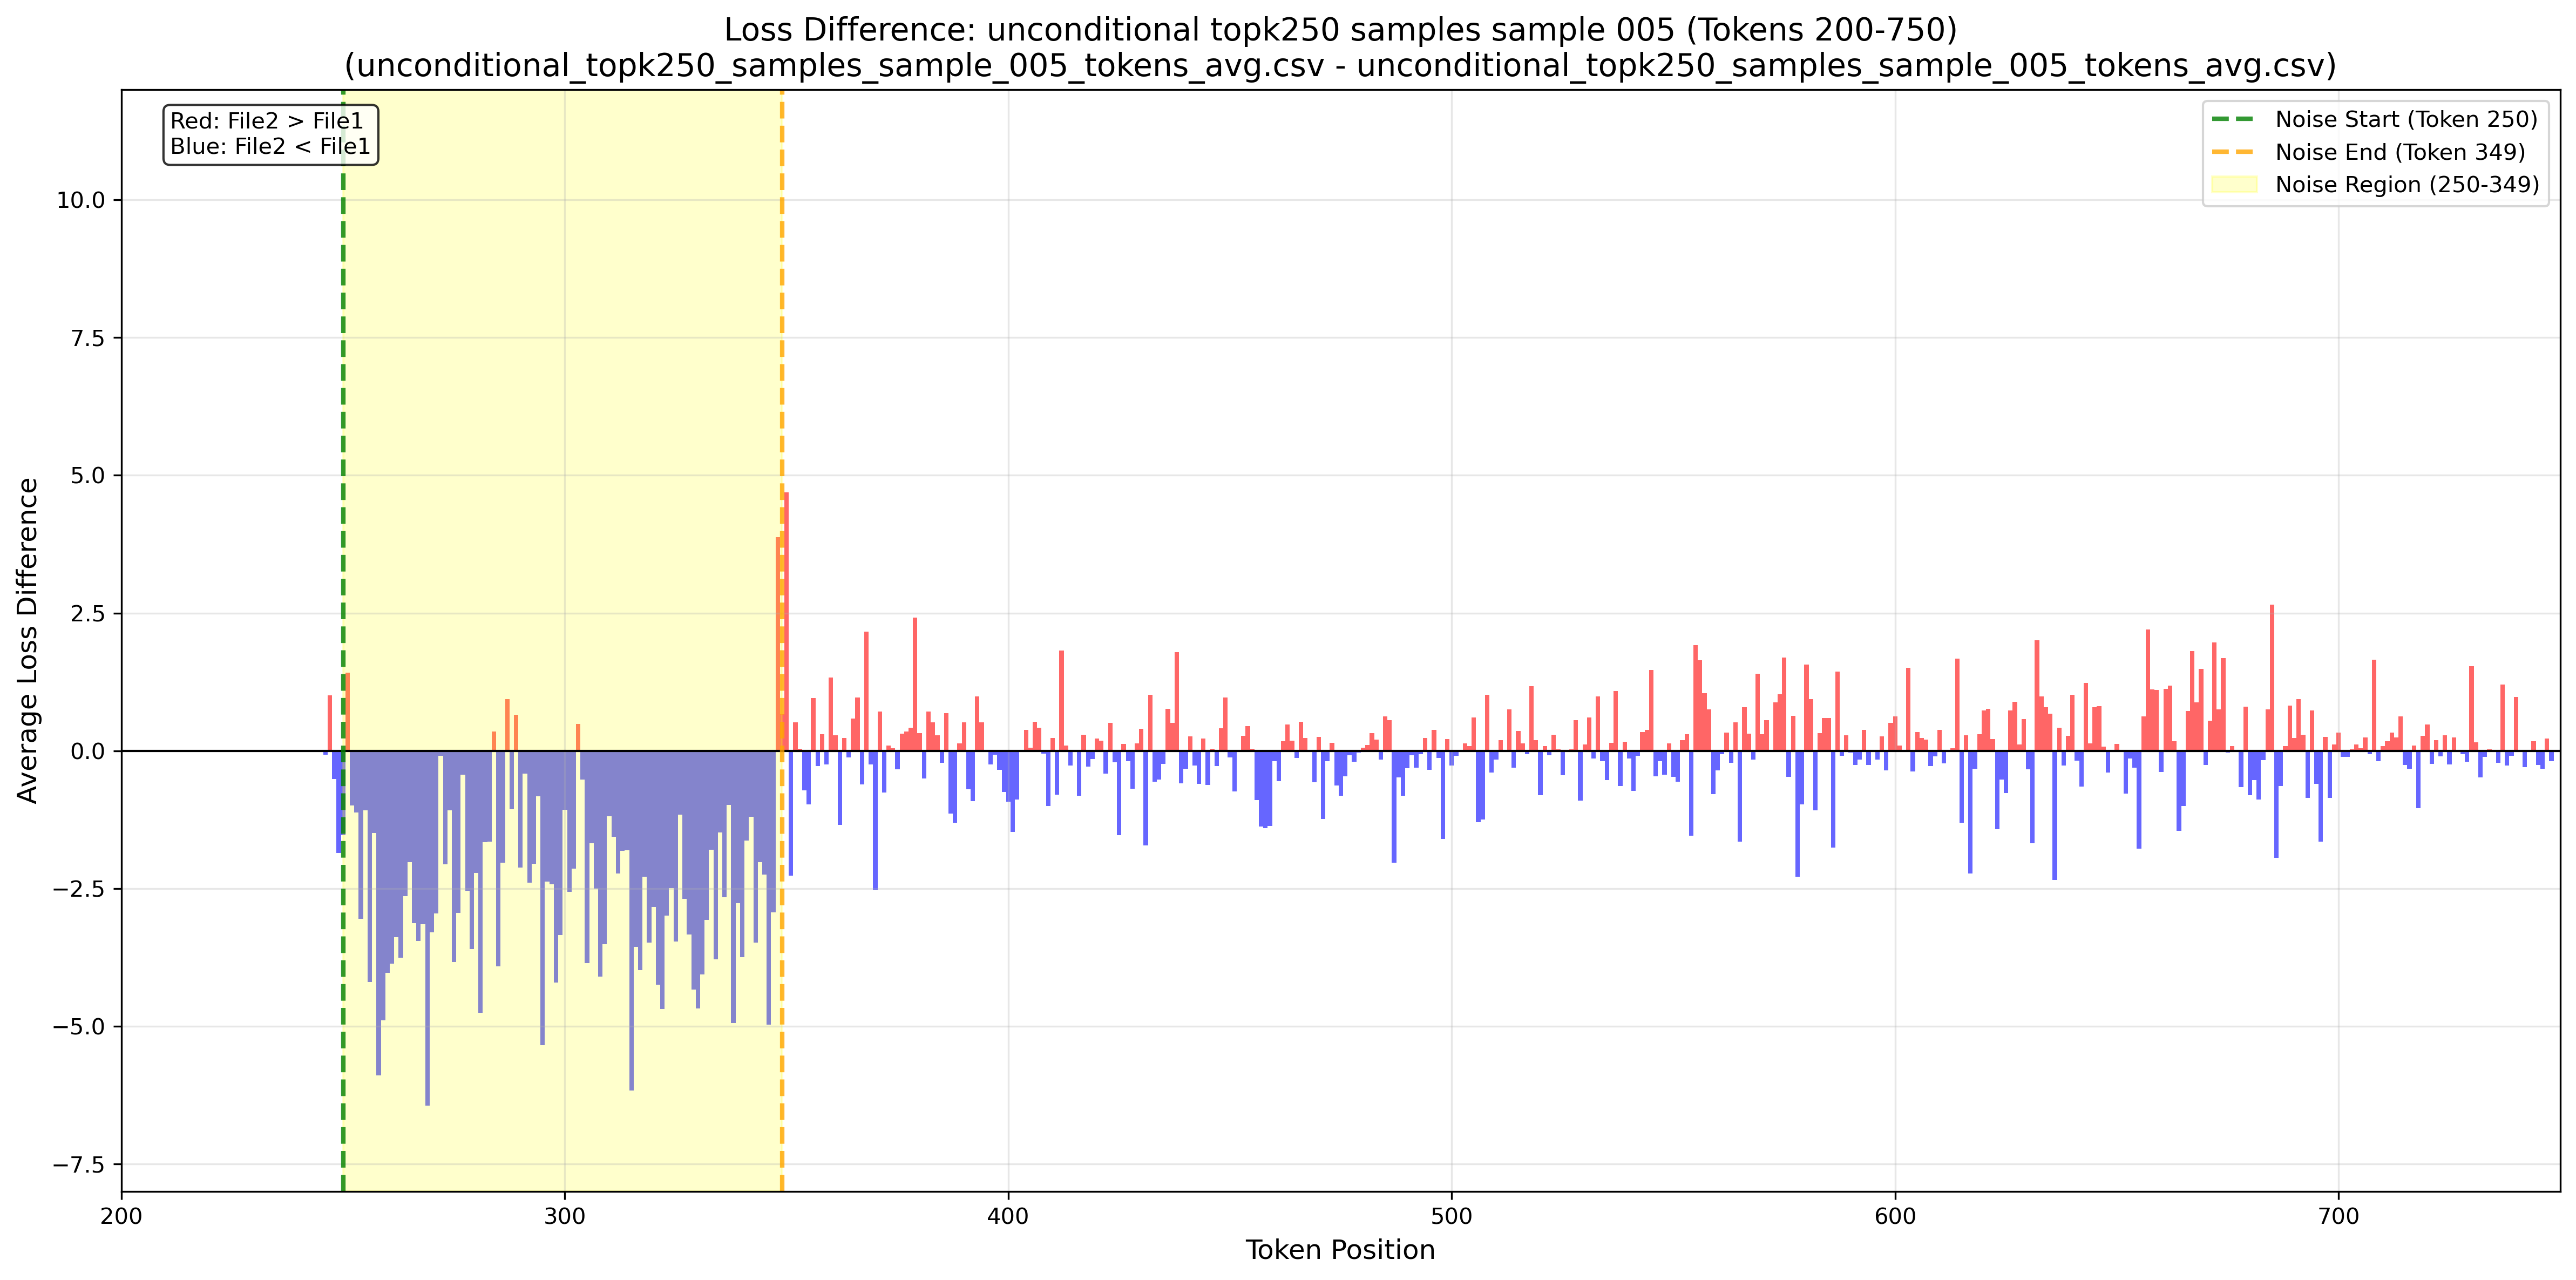
Figure 1-5 Loss Difference.
Generated Datasets - Topk = 250 - Sample 006
Original (Loss: 6.55)
Noise injected (Loss: 6.22)
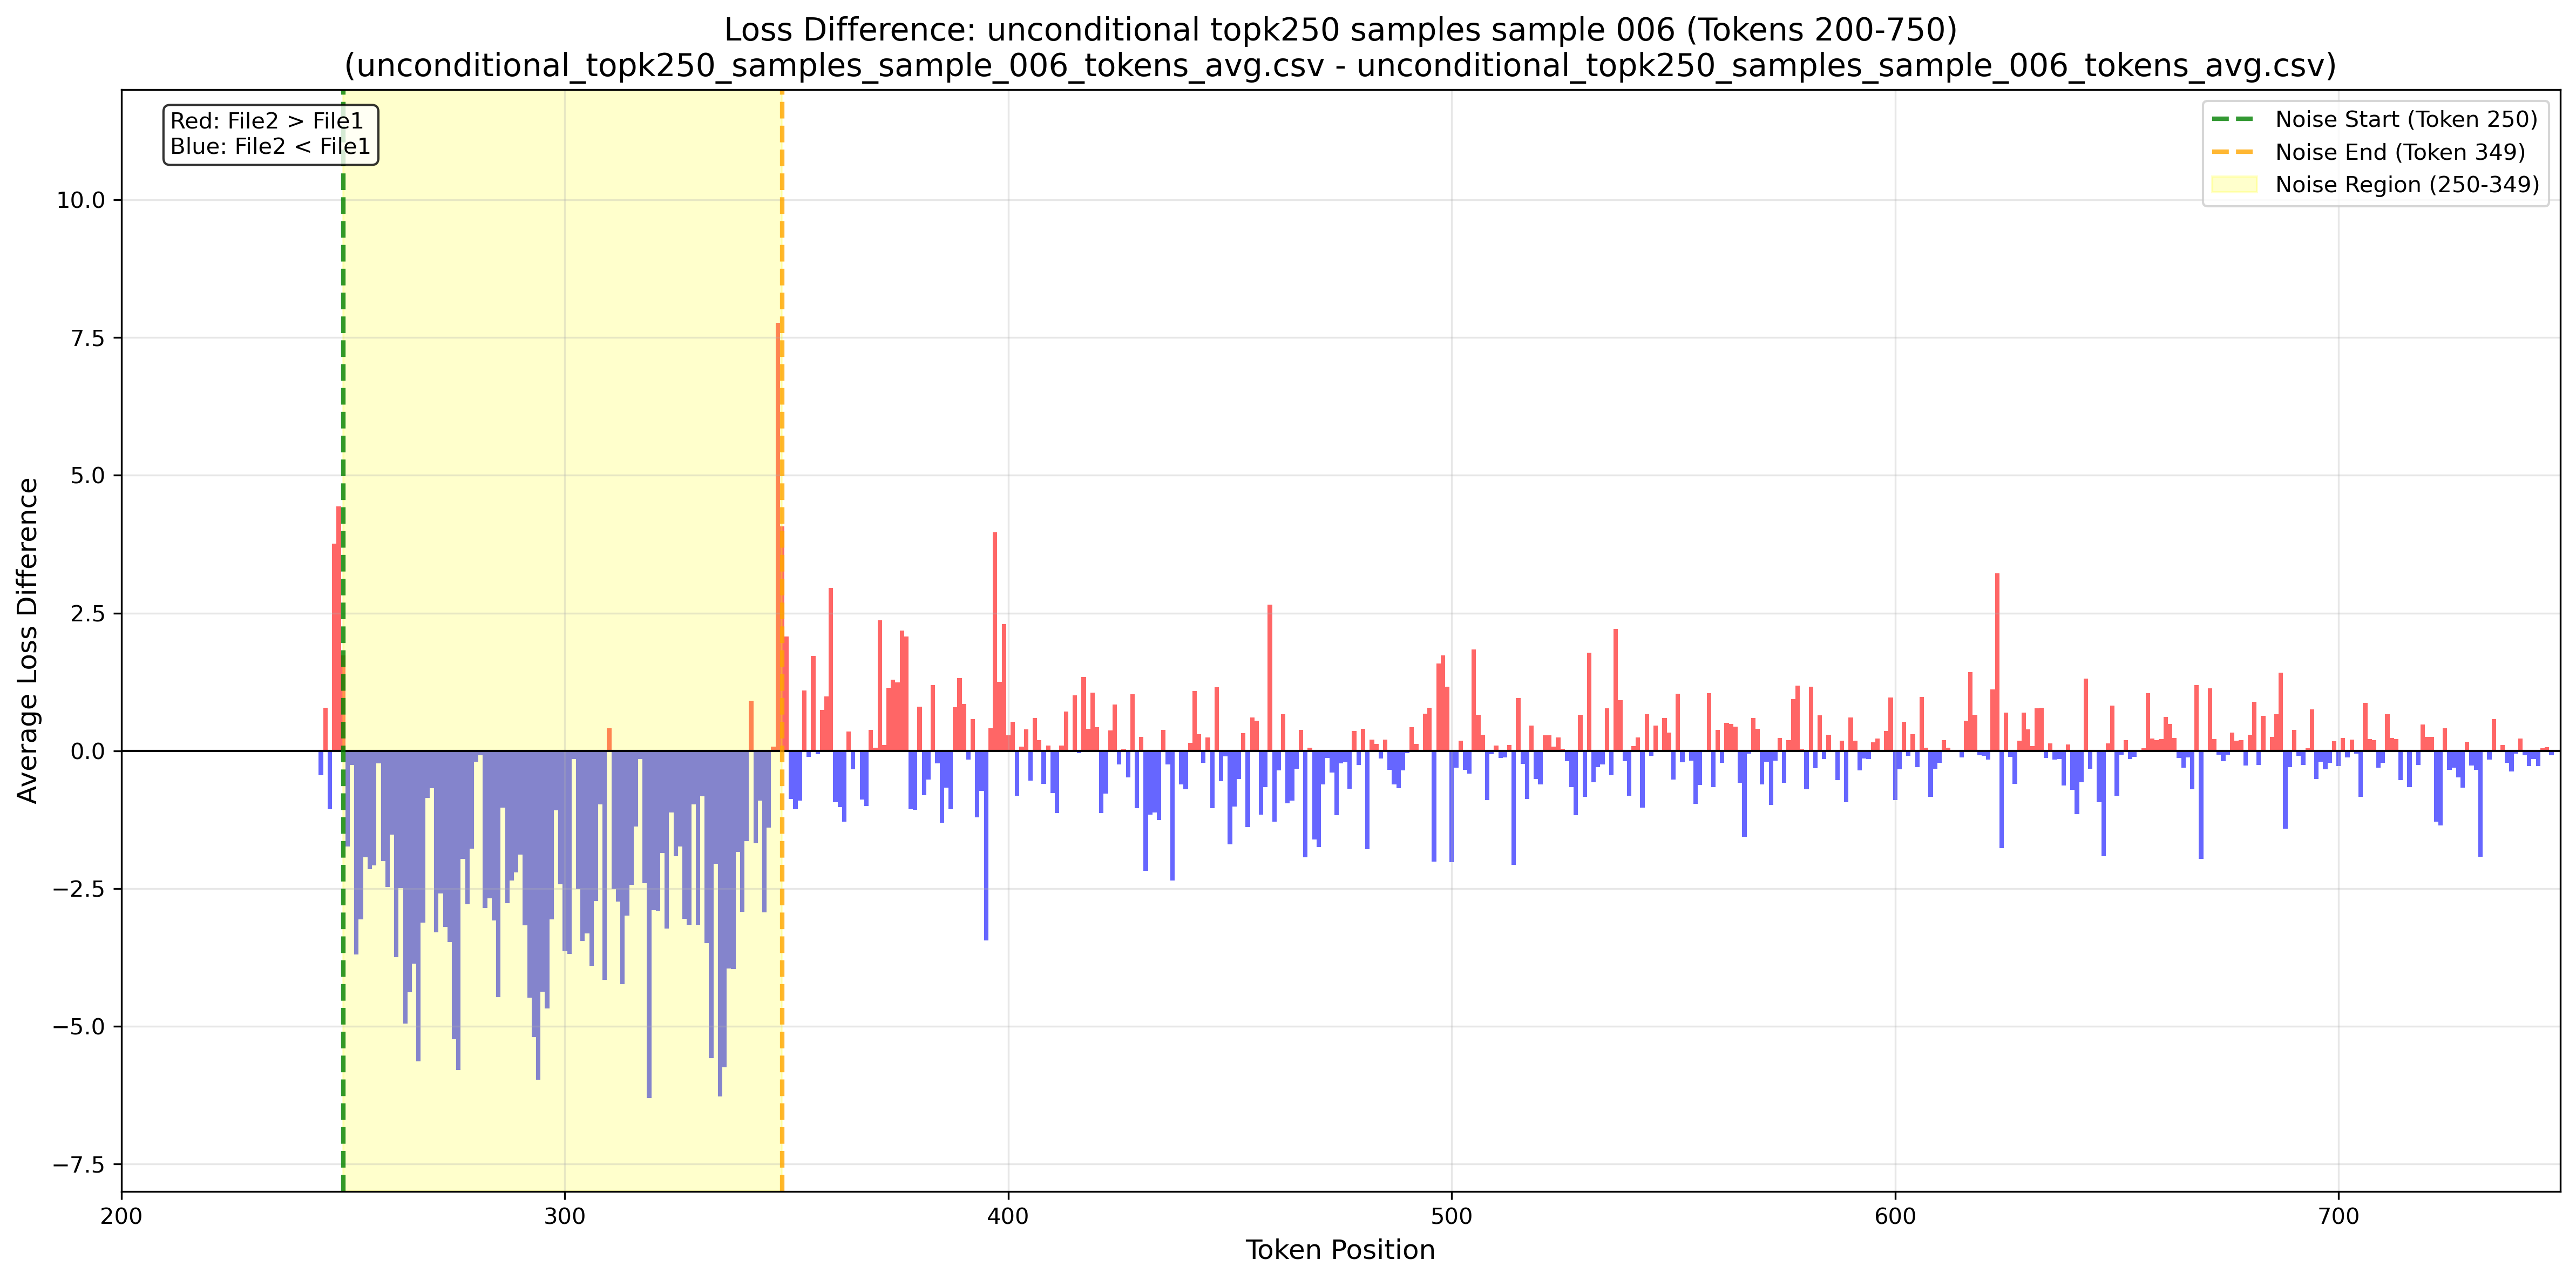
Figure 1-6 Loss Difference.
Training Datasets - Spreading Your Wings
Original (Loss: 6.25)
Noise injected (Loss: 6.00)
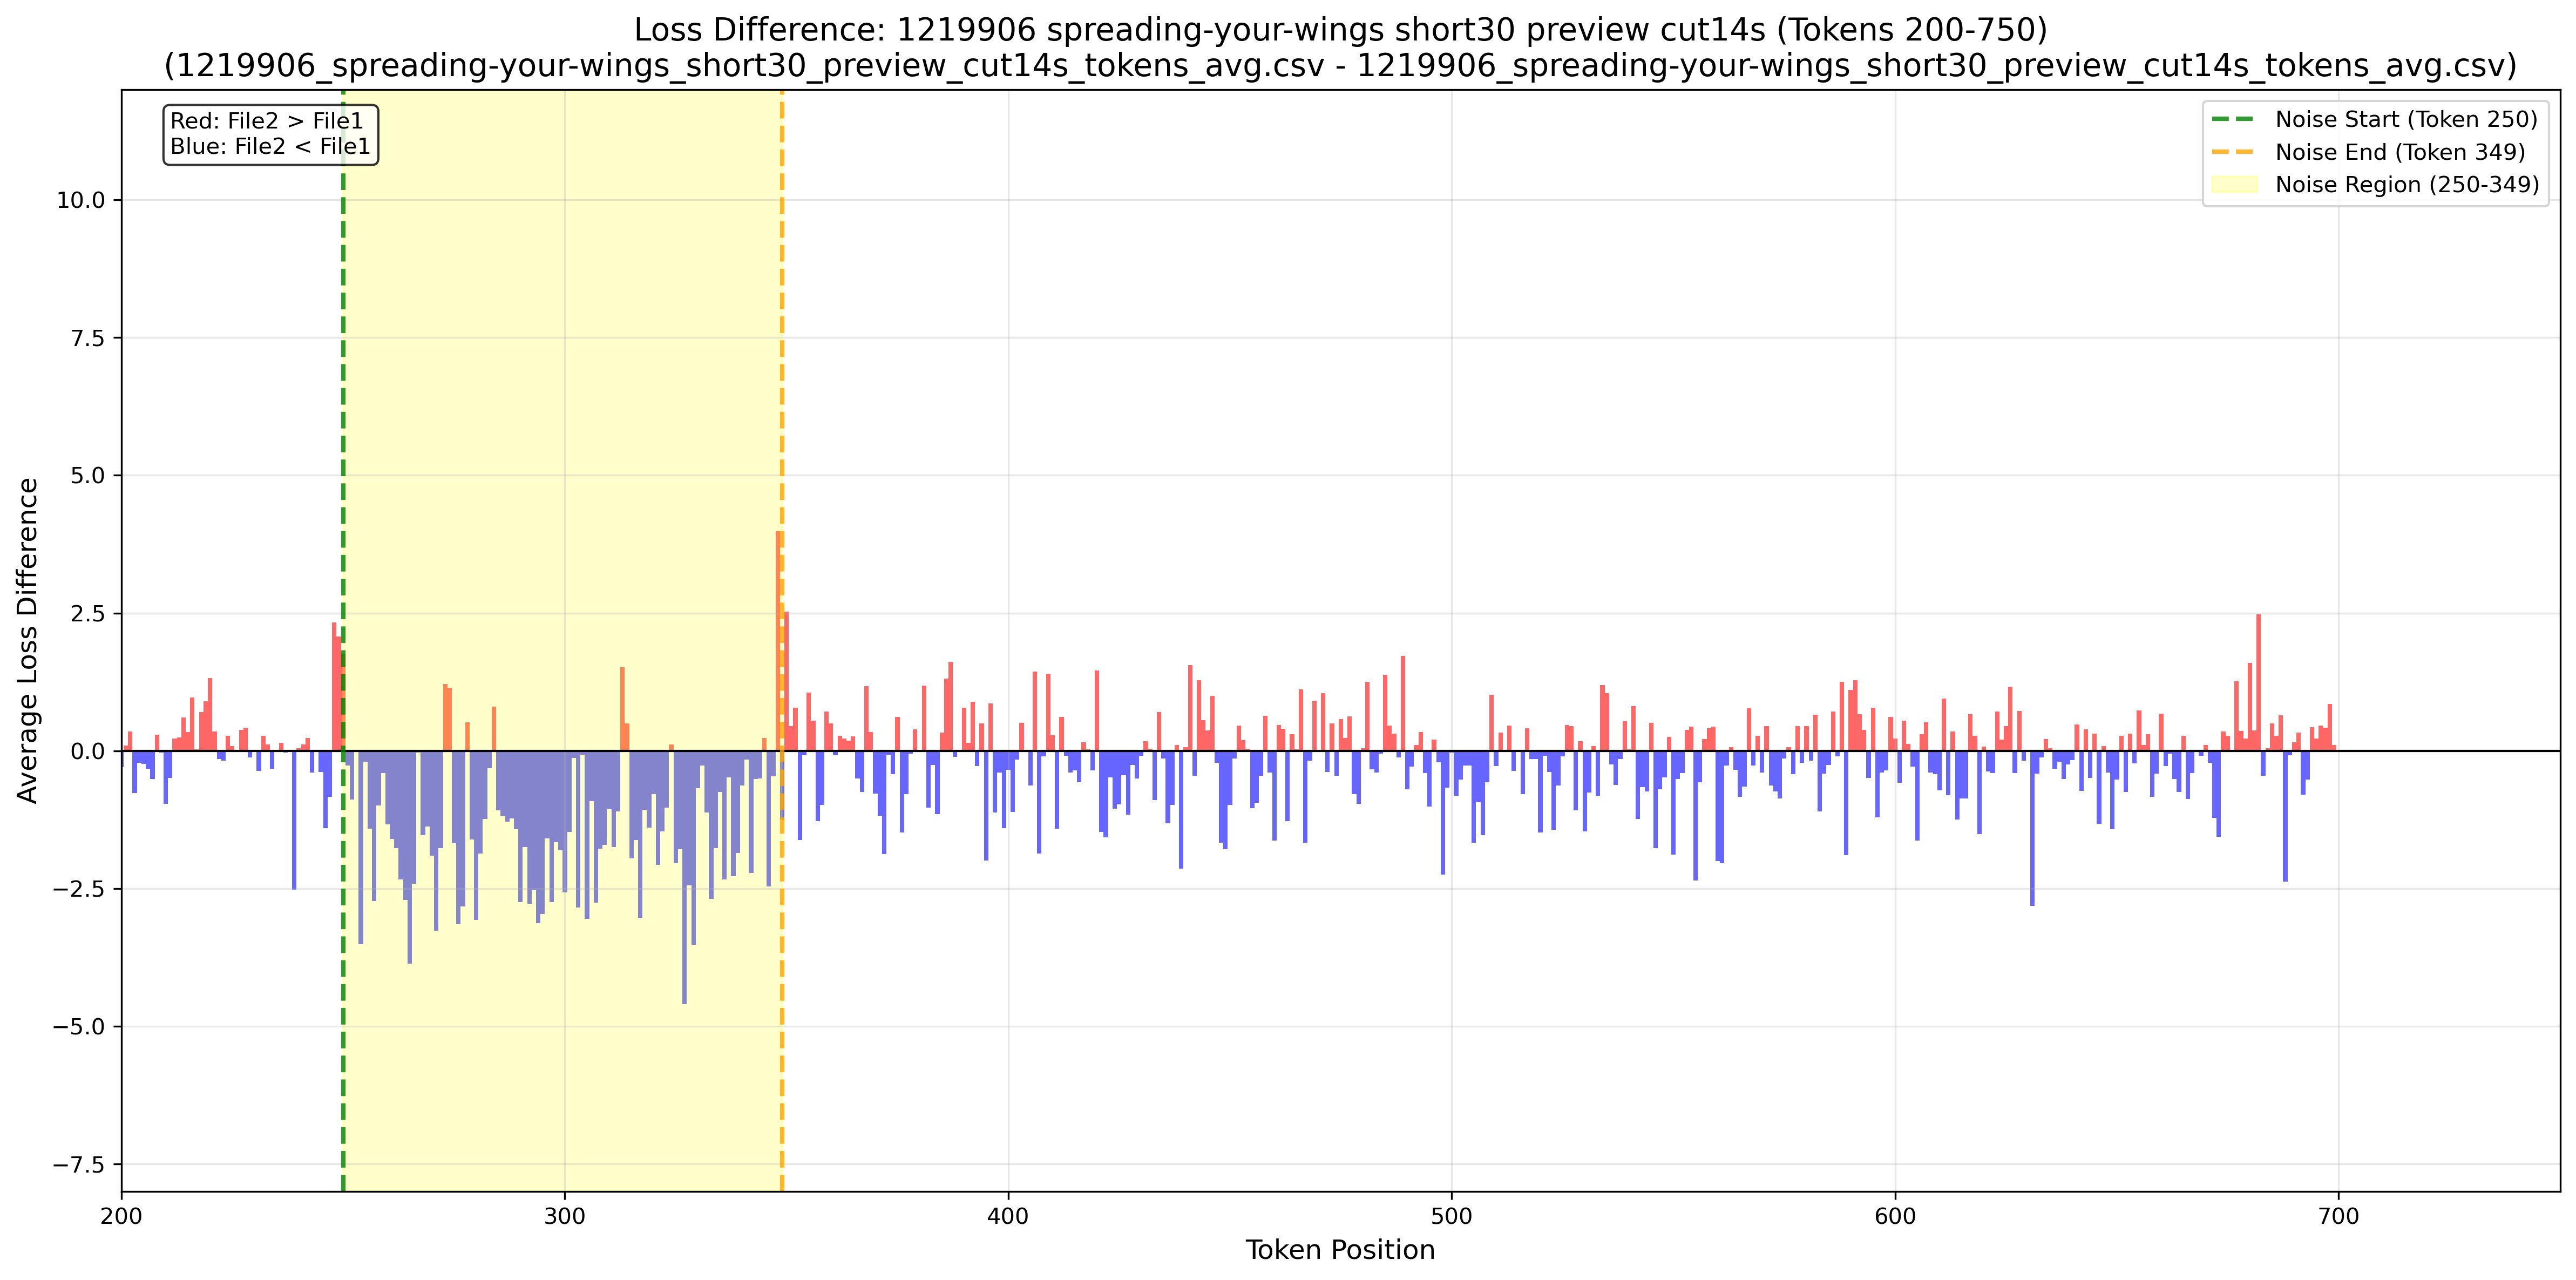
Figure 1-7 Loss Difference.
Training Datasets - The Drive for Resolution
Original (Loss: 6.04)
Noise injected (Loss: 5.92)
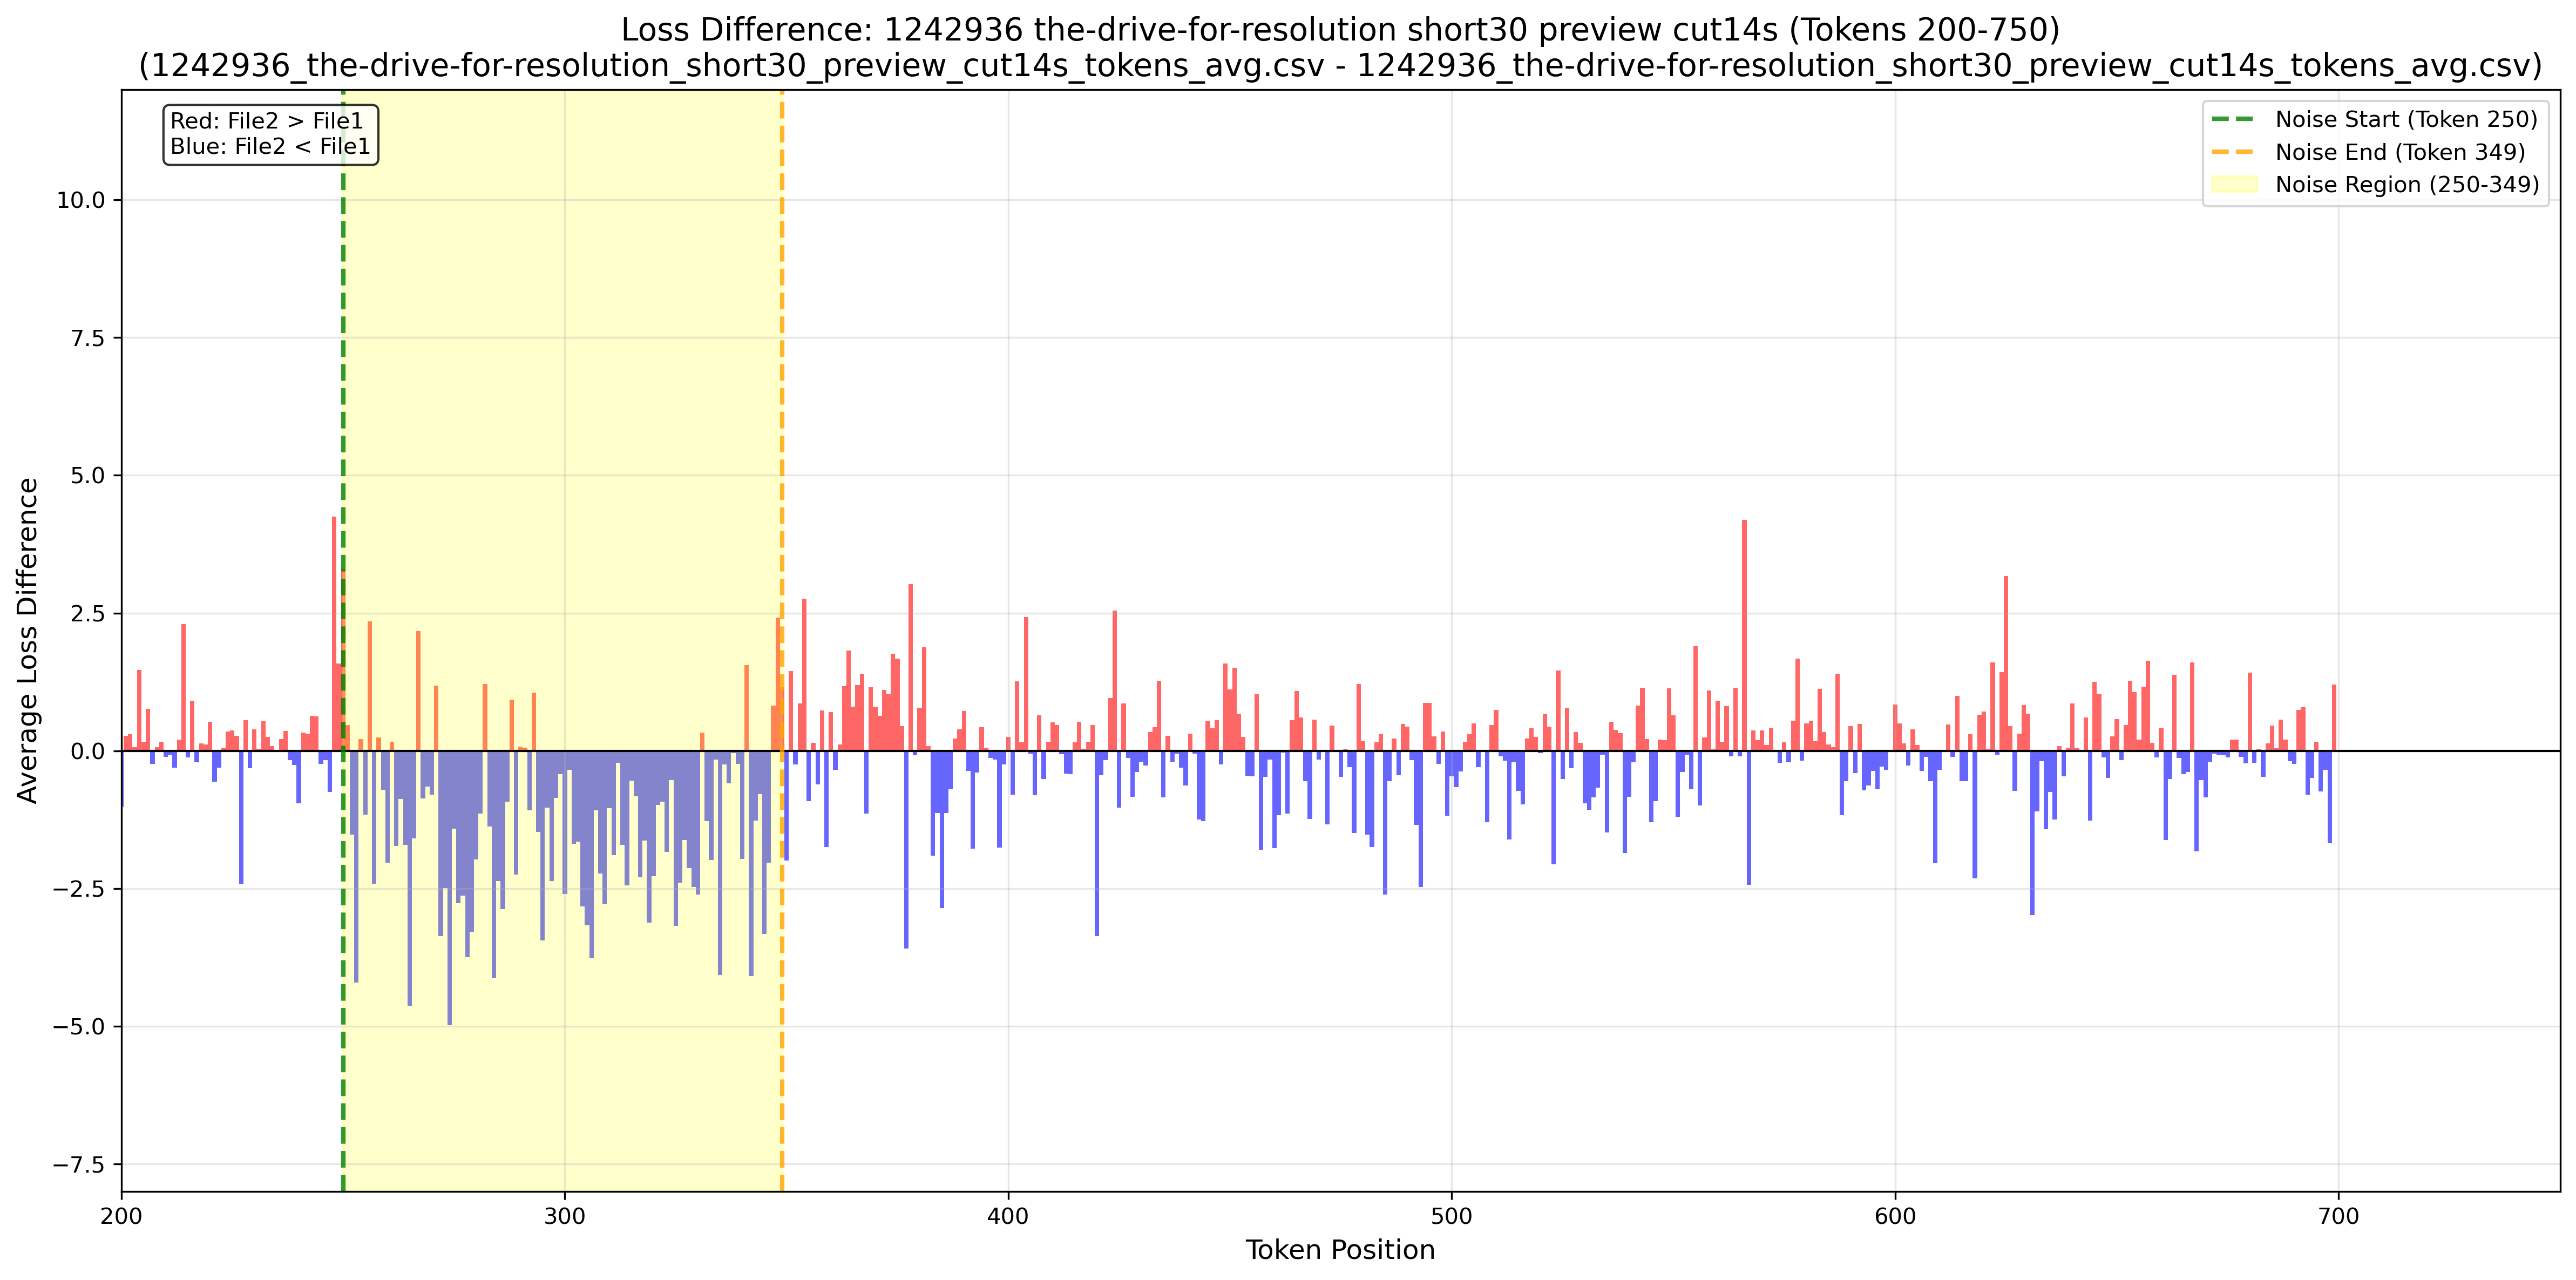
Figure 1-8 Loss Difference.
Training Datasets - Wistful Longing
Original (Loss: 6.12)
Noise injected (Loss: 5.93)
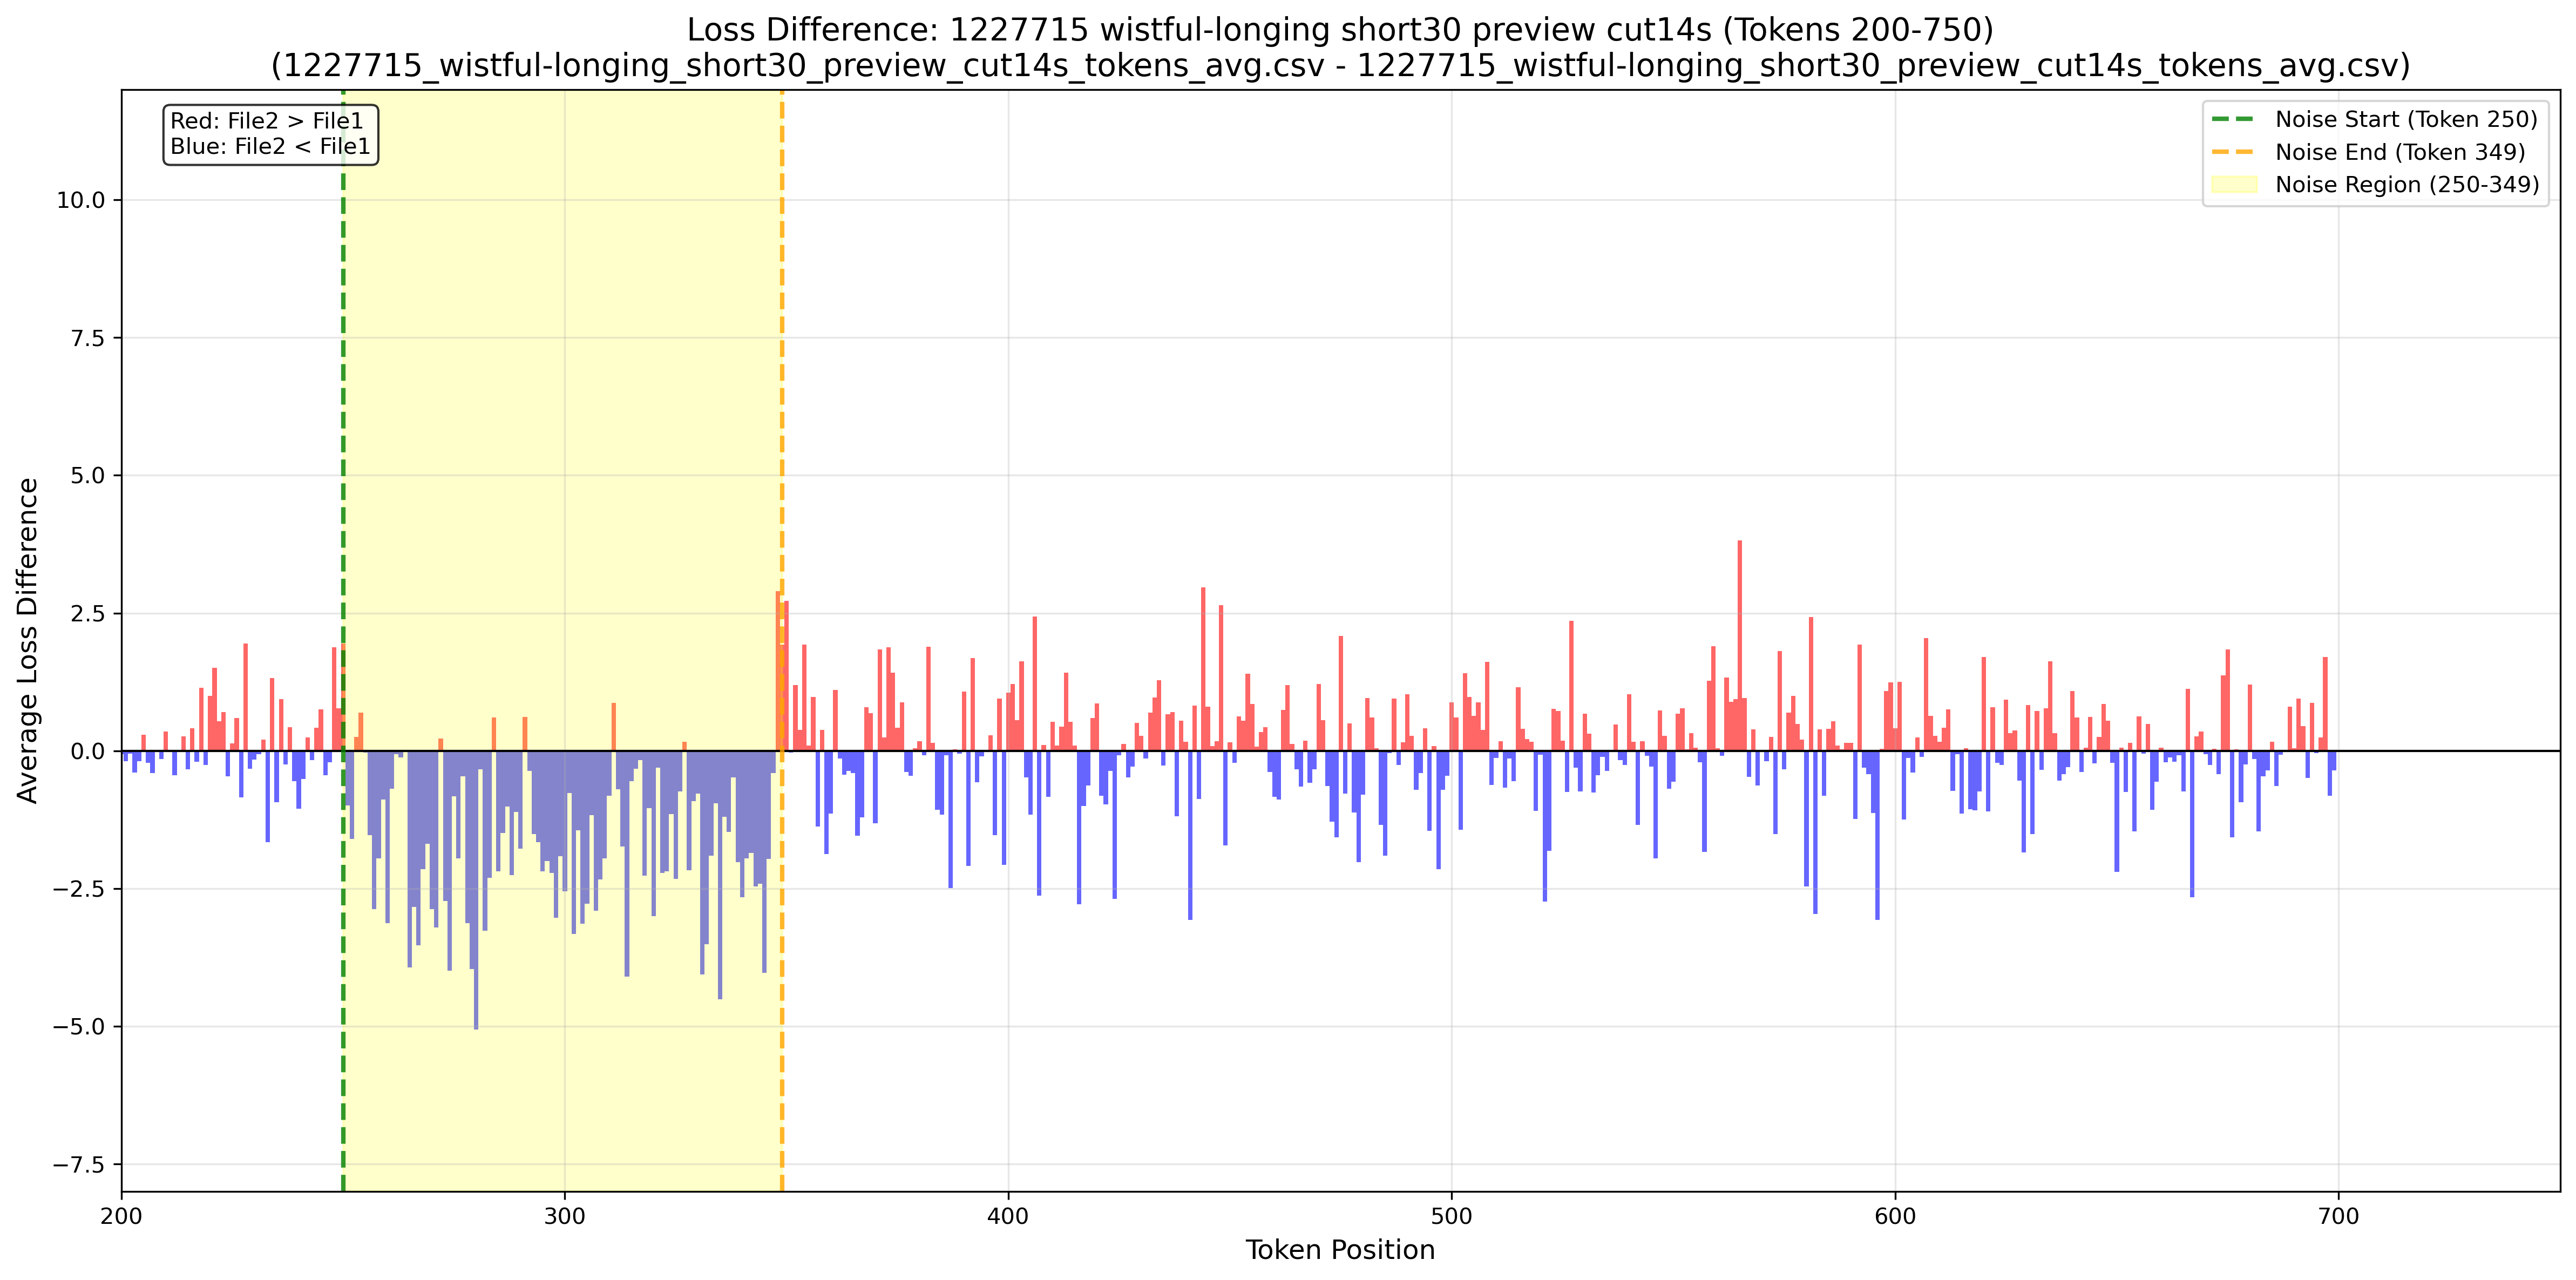
Figure 1-9 Loss Difference.
Suppement Experiment - Loss under Different Noise Injection
Across injection at blue/pink/brown noise types, Cross Entropy Loss remains similar behavior.
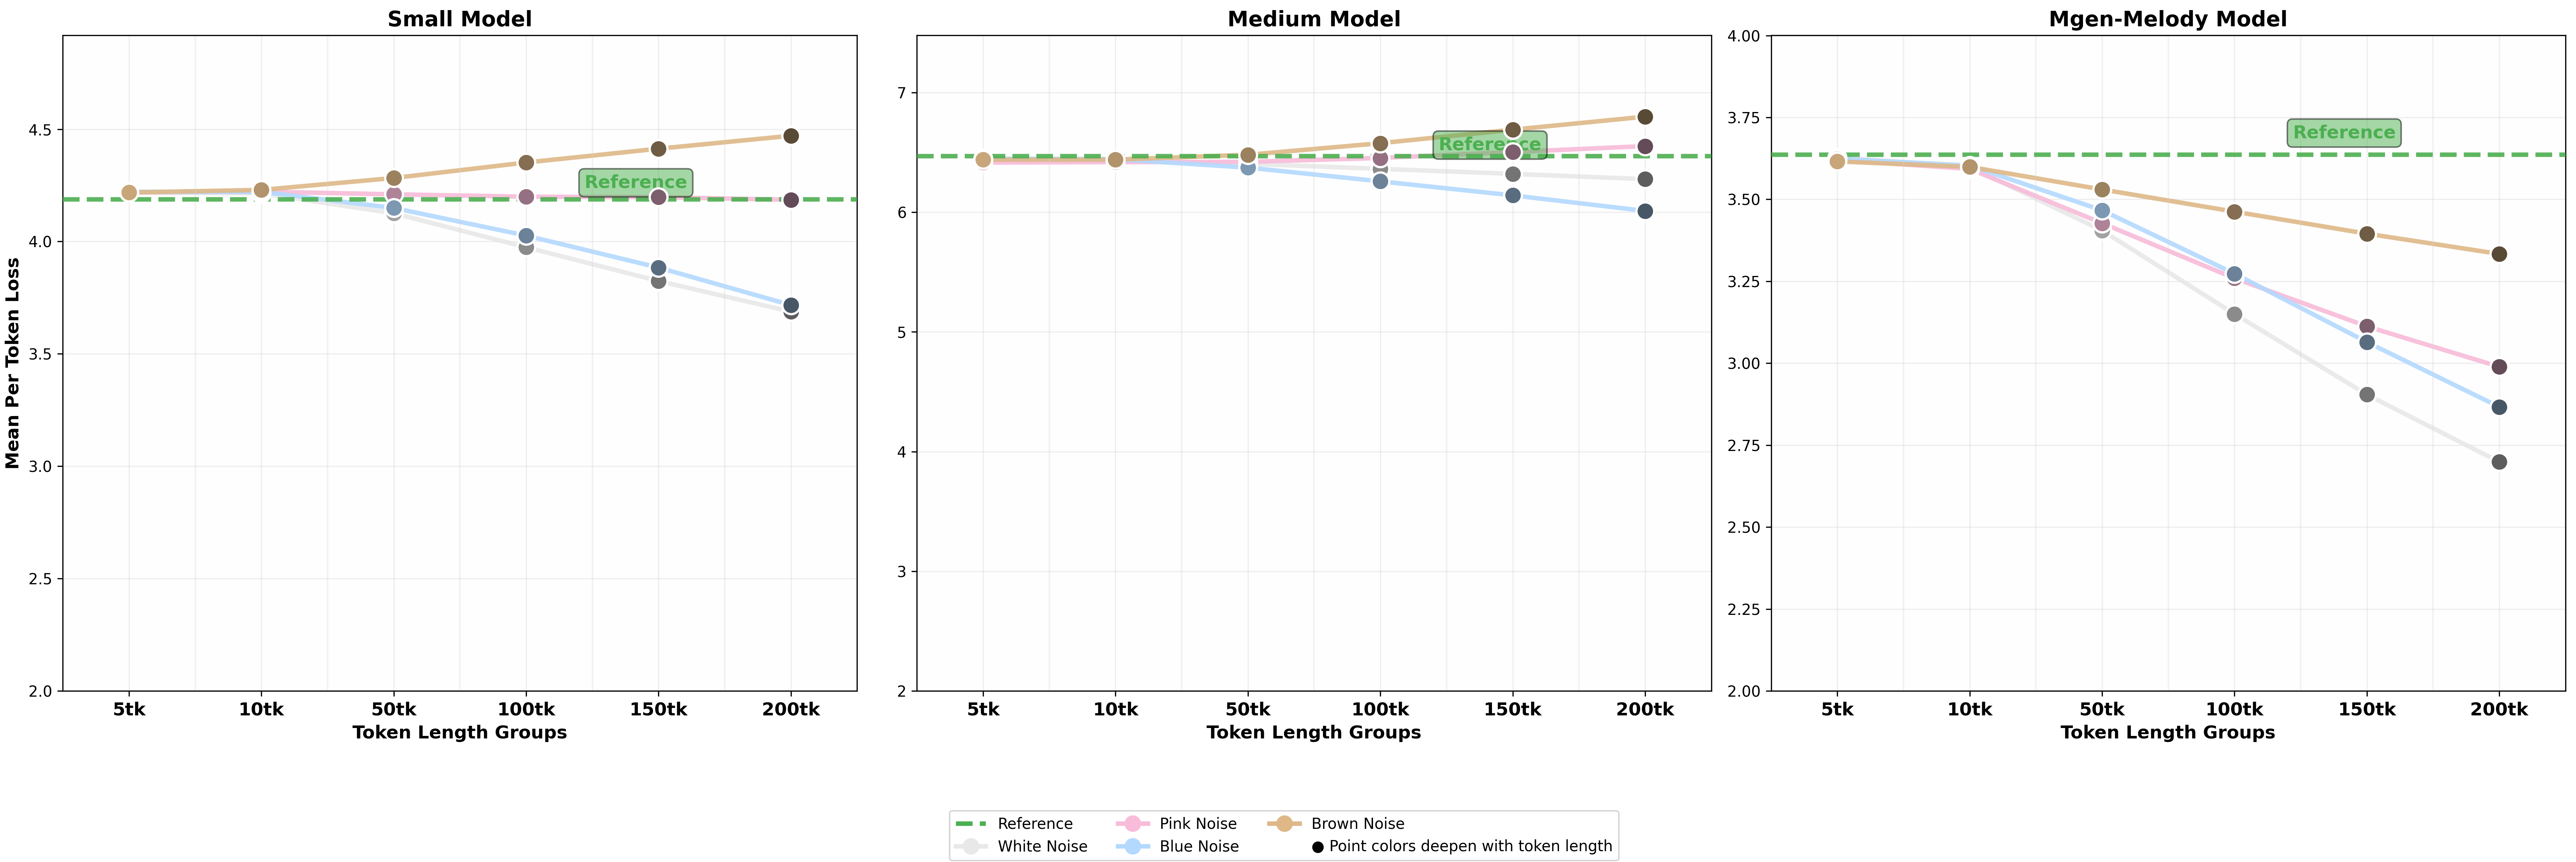
Figure 2-1. Loss under Different Noise Injection - OOD Datasets.
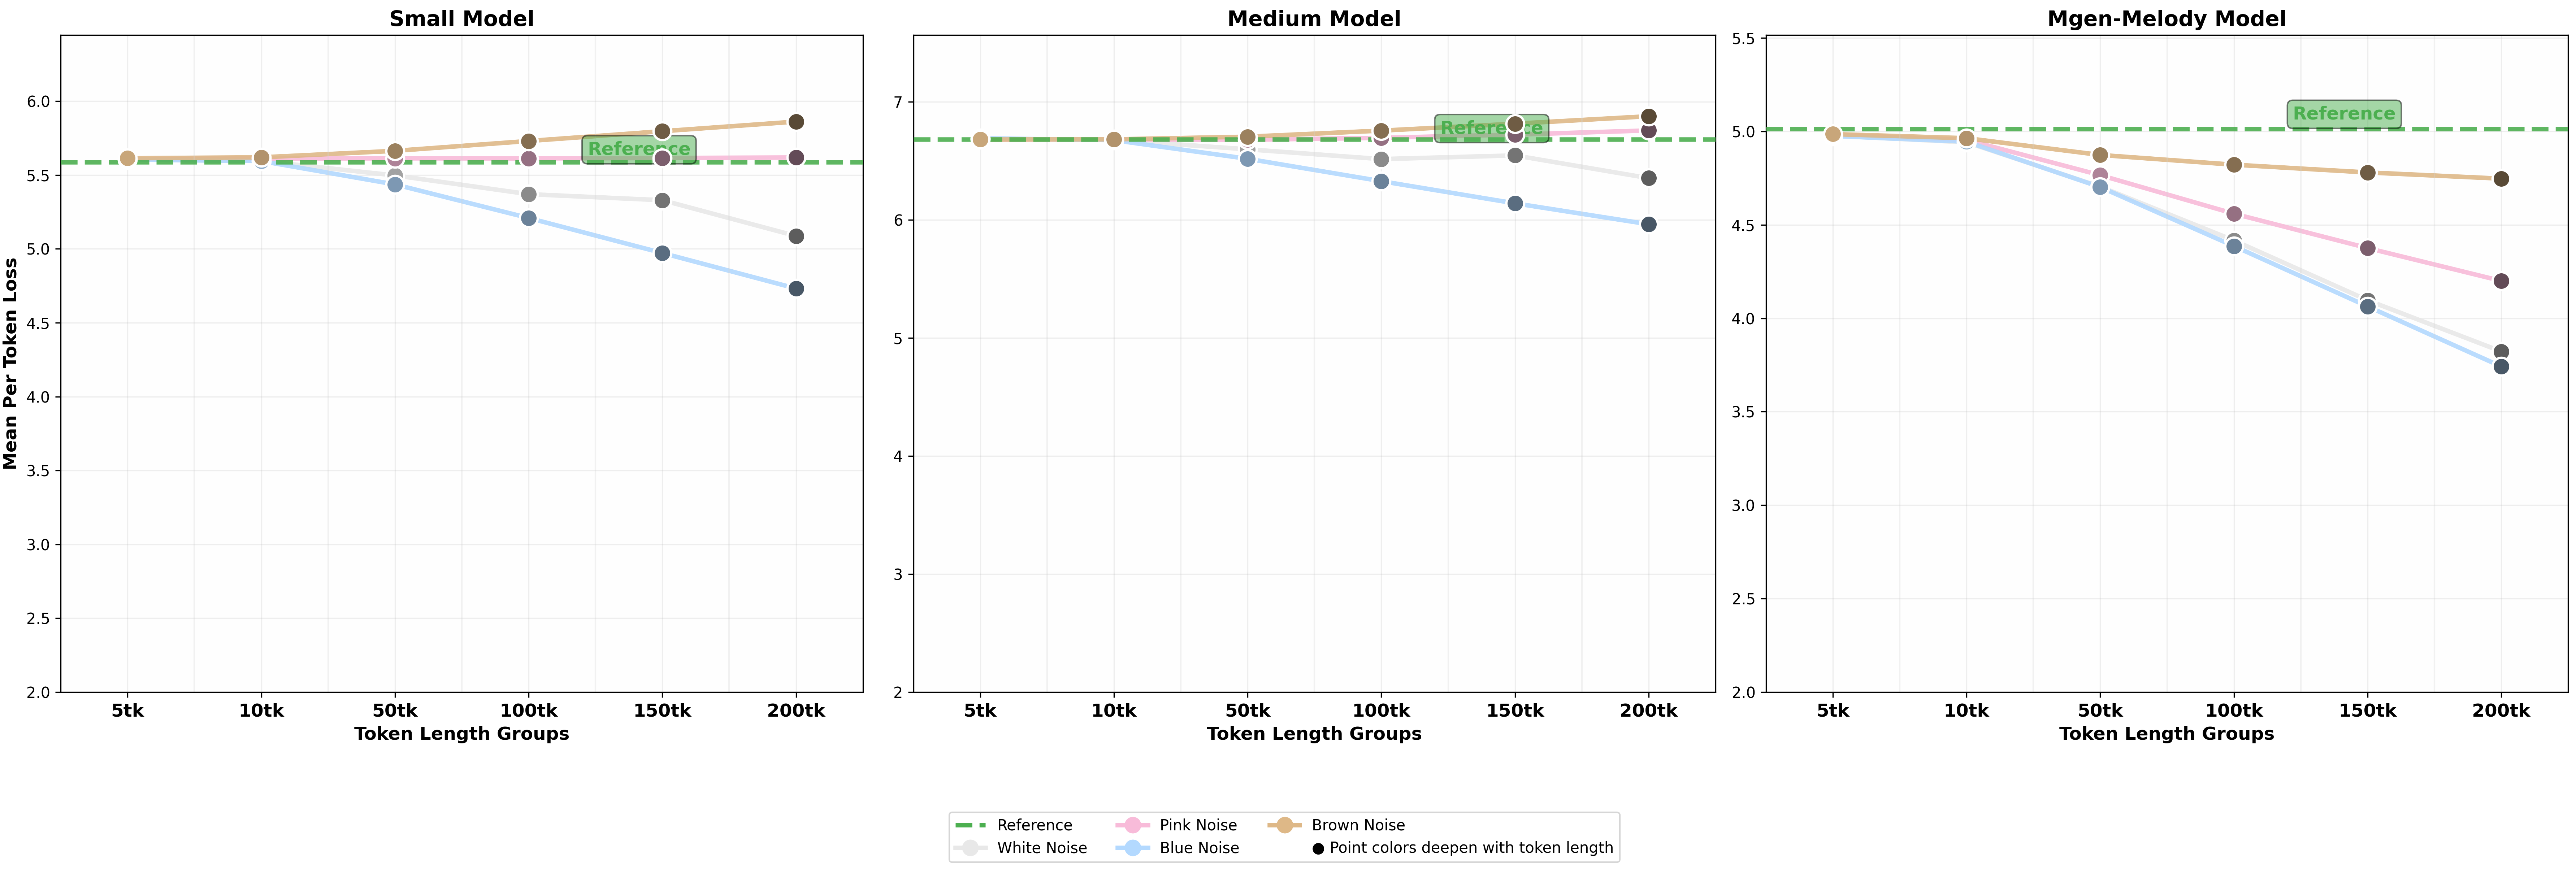
Figure 2-2. Loss under Different Noise Injection - Generated Datasets.
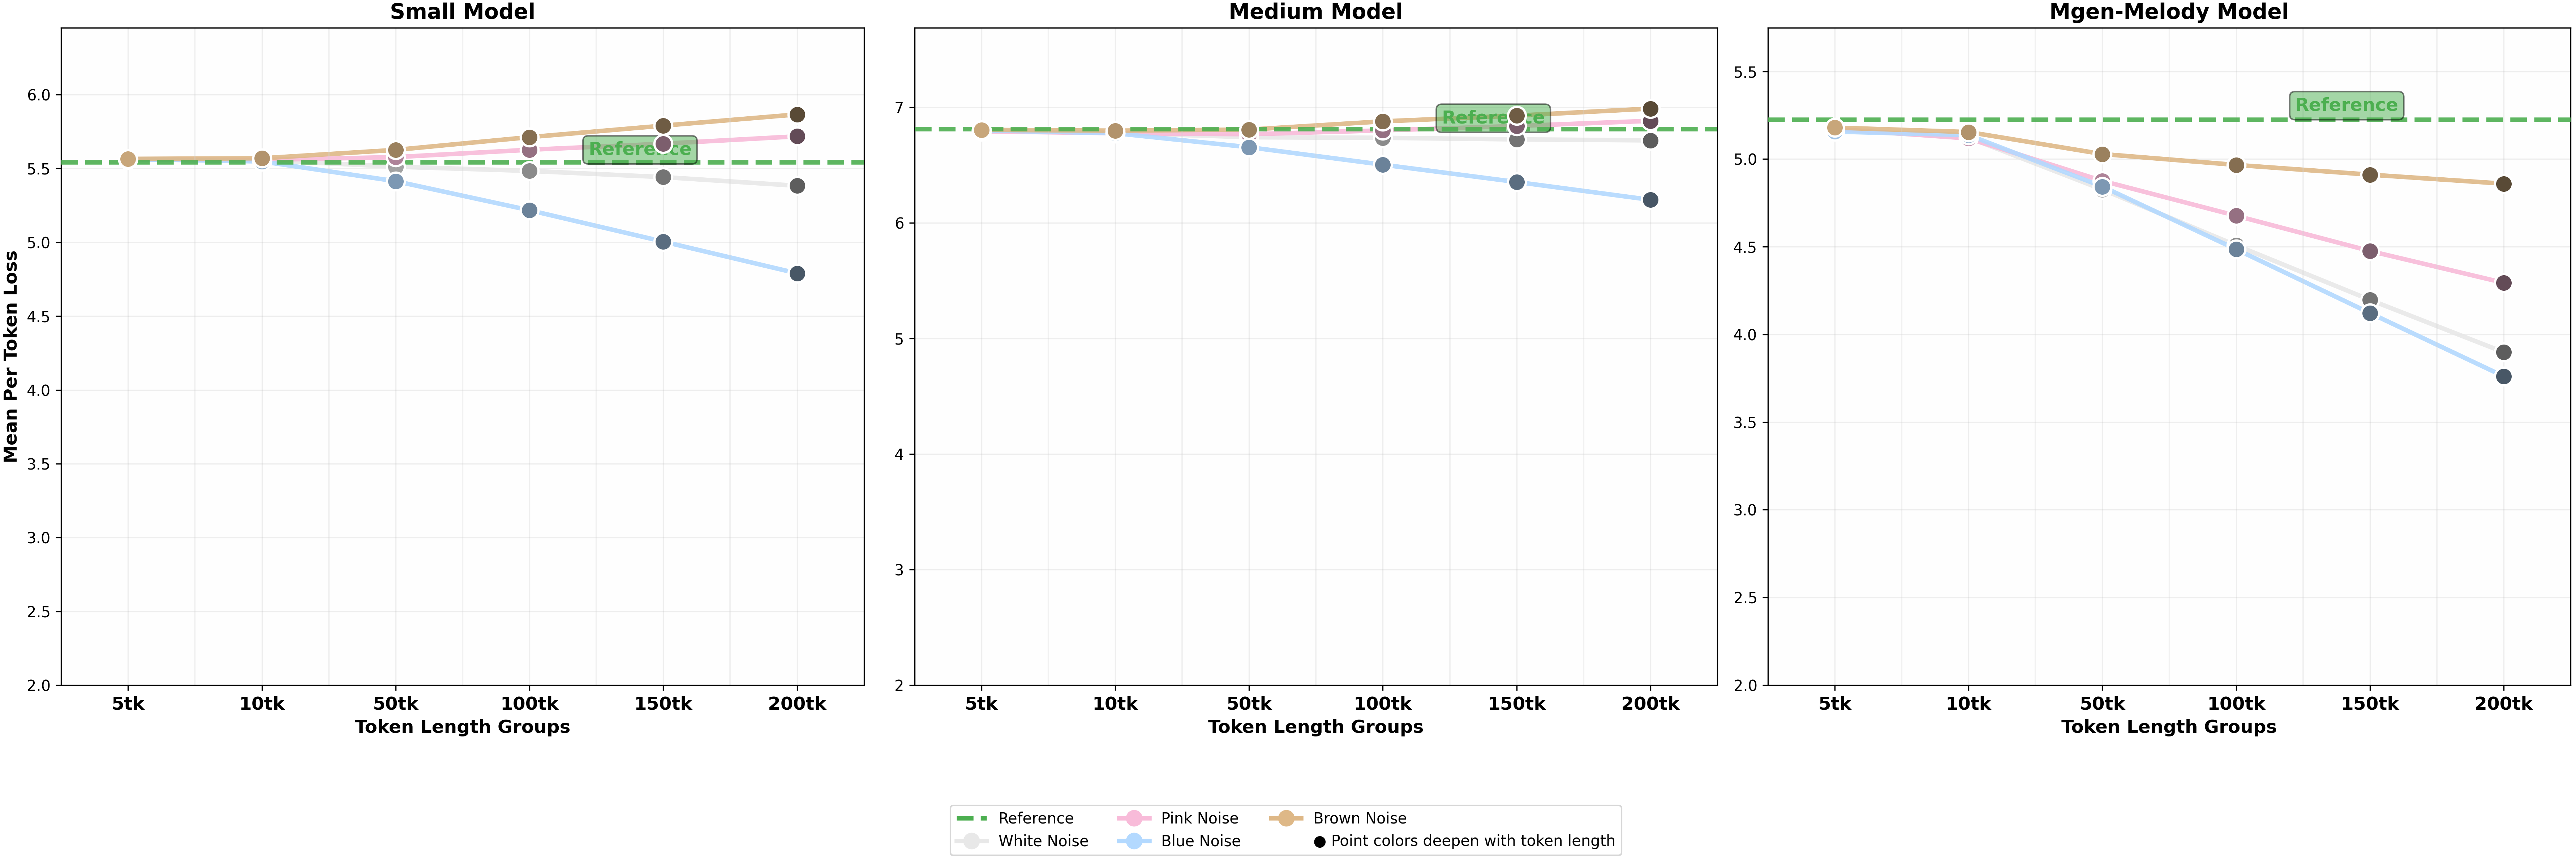
Figure 2-3. Loss under Different Noise Injection - Training Datasets.
Additional Tests
Additional tests (rhythm deletion, velocity, structure) further show absolute loss is unreliable.
Rhythm Deletion
Original (Loss: 6.46)
Rhythm deletion for 40 percents of the original music. (Loss: 6.05)
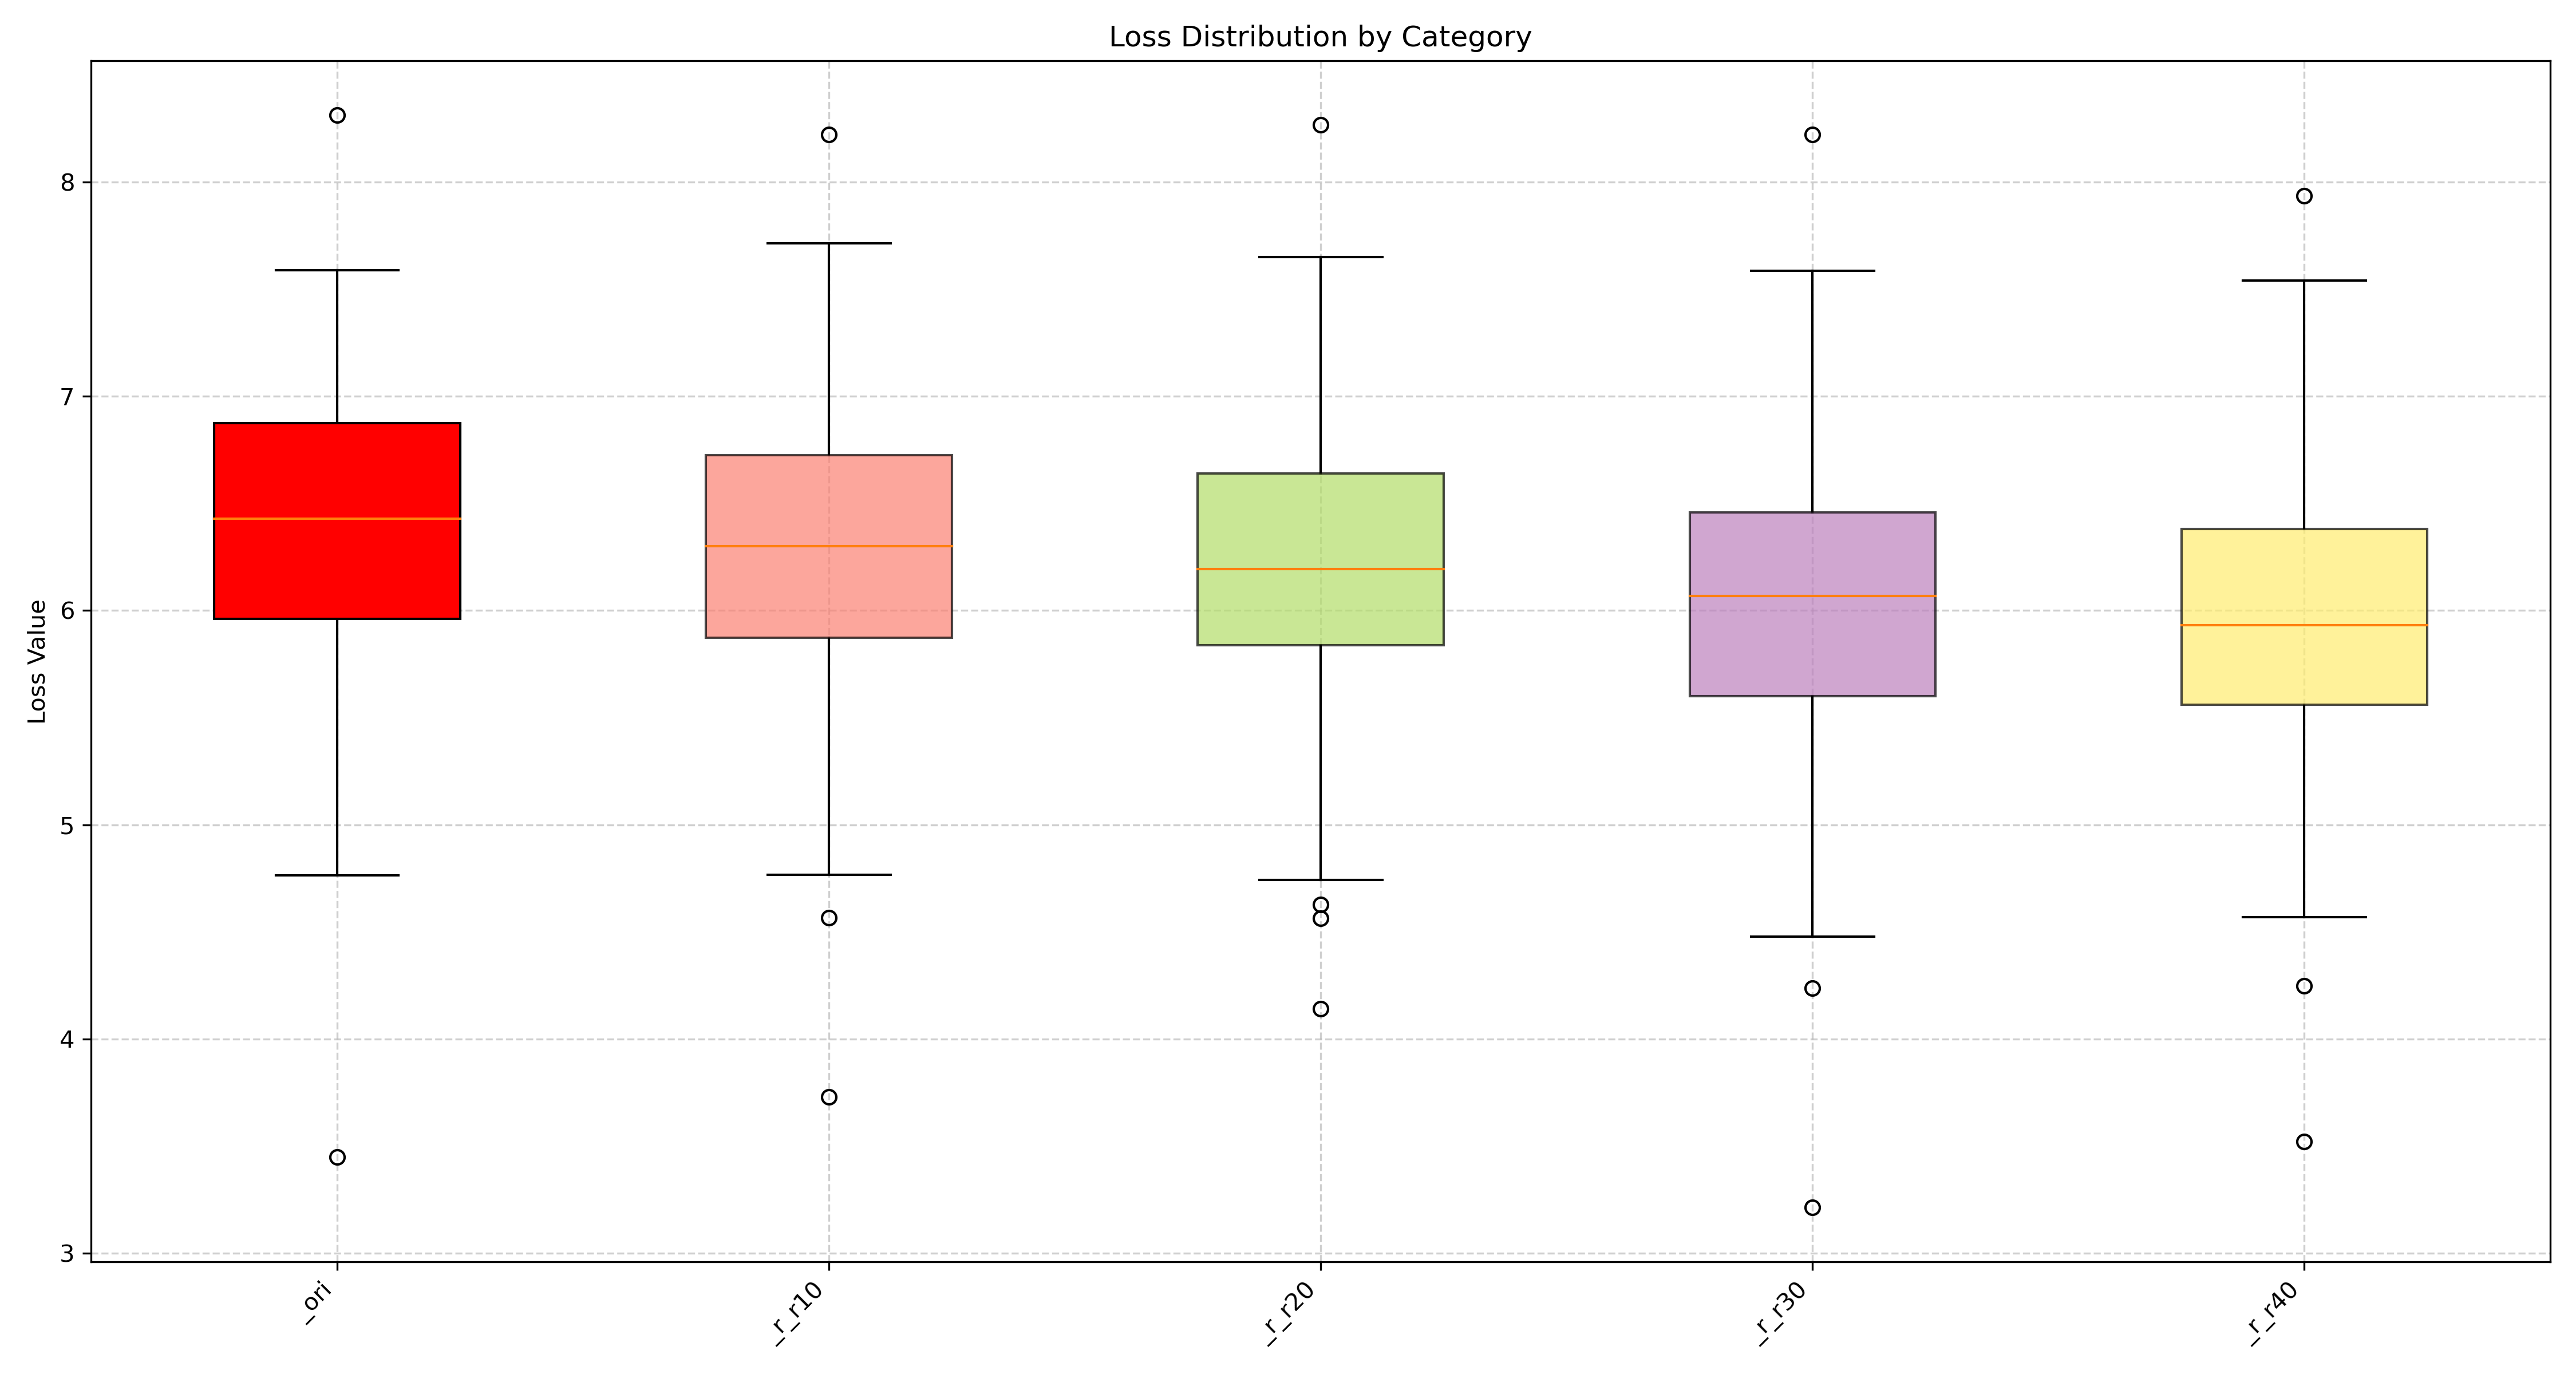
Figure 3-1. Rhythm Deletion.
Note Velocity Change
Original (Loss: 6.46)
Note velocity changed for 50 percents of the original music. (Loss: 6.01)
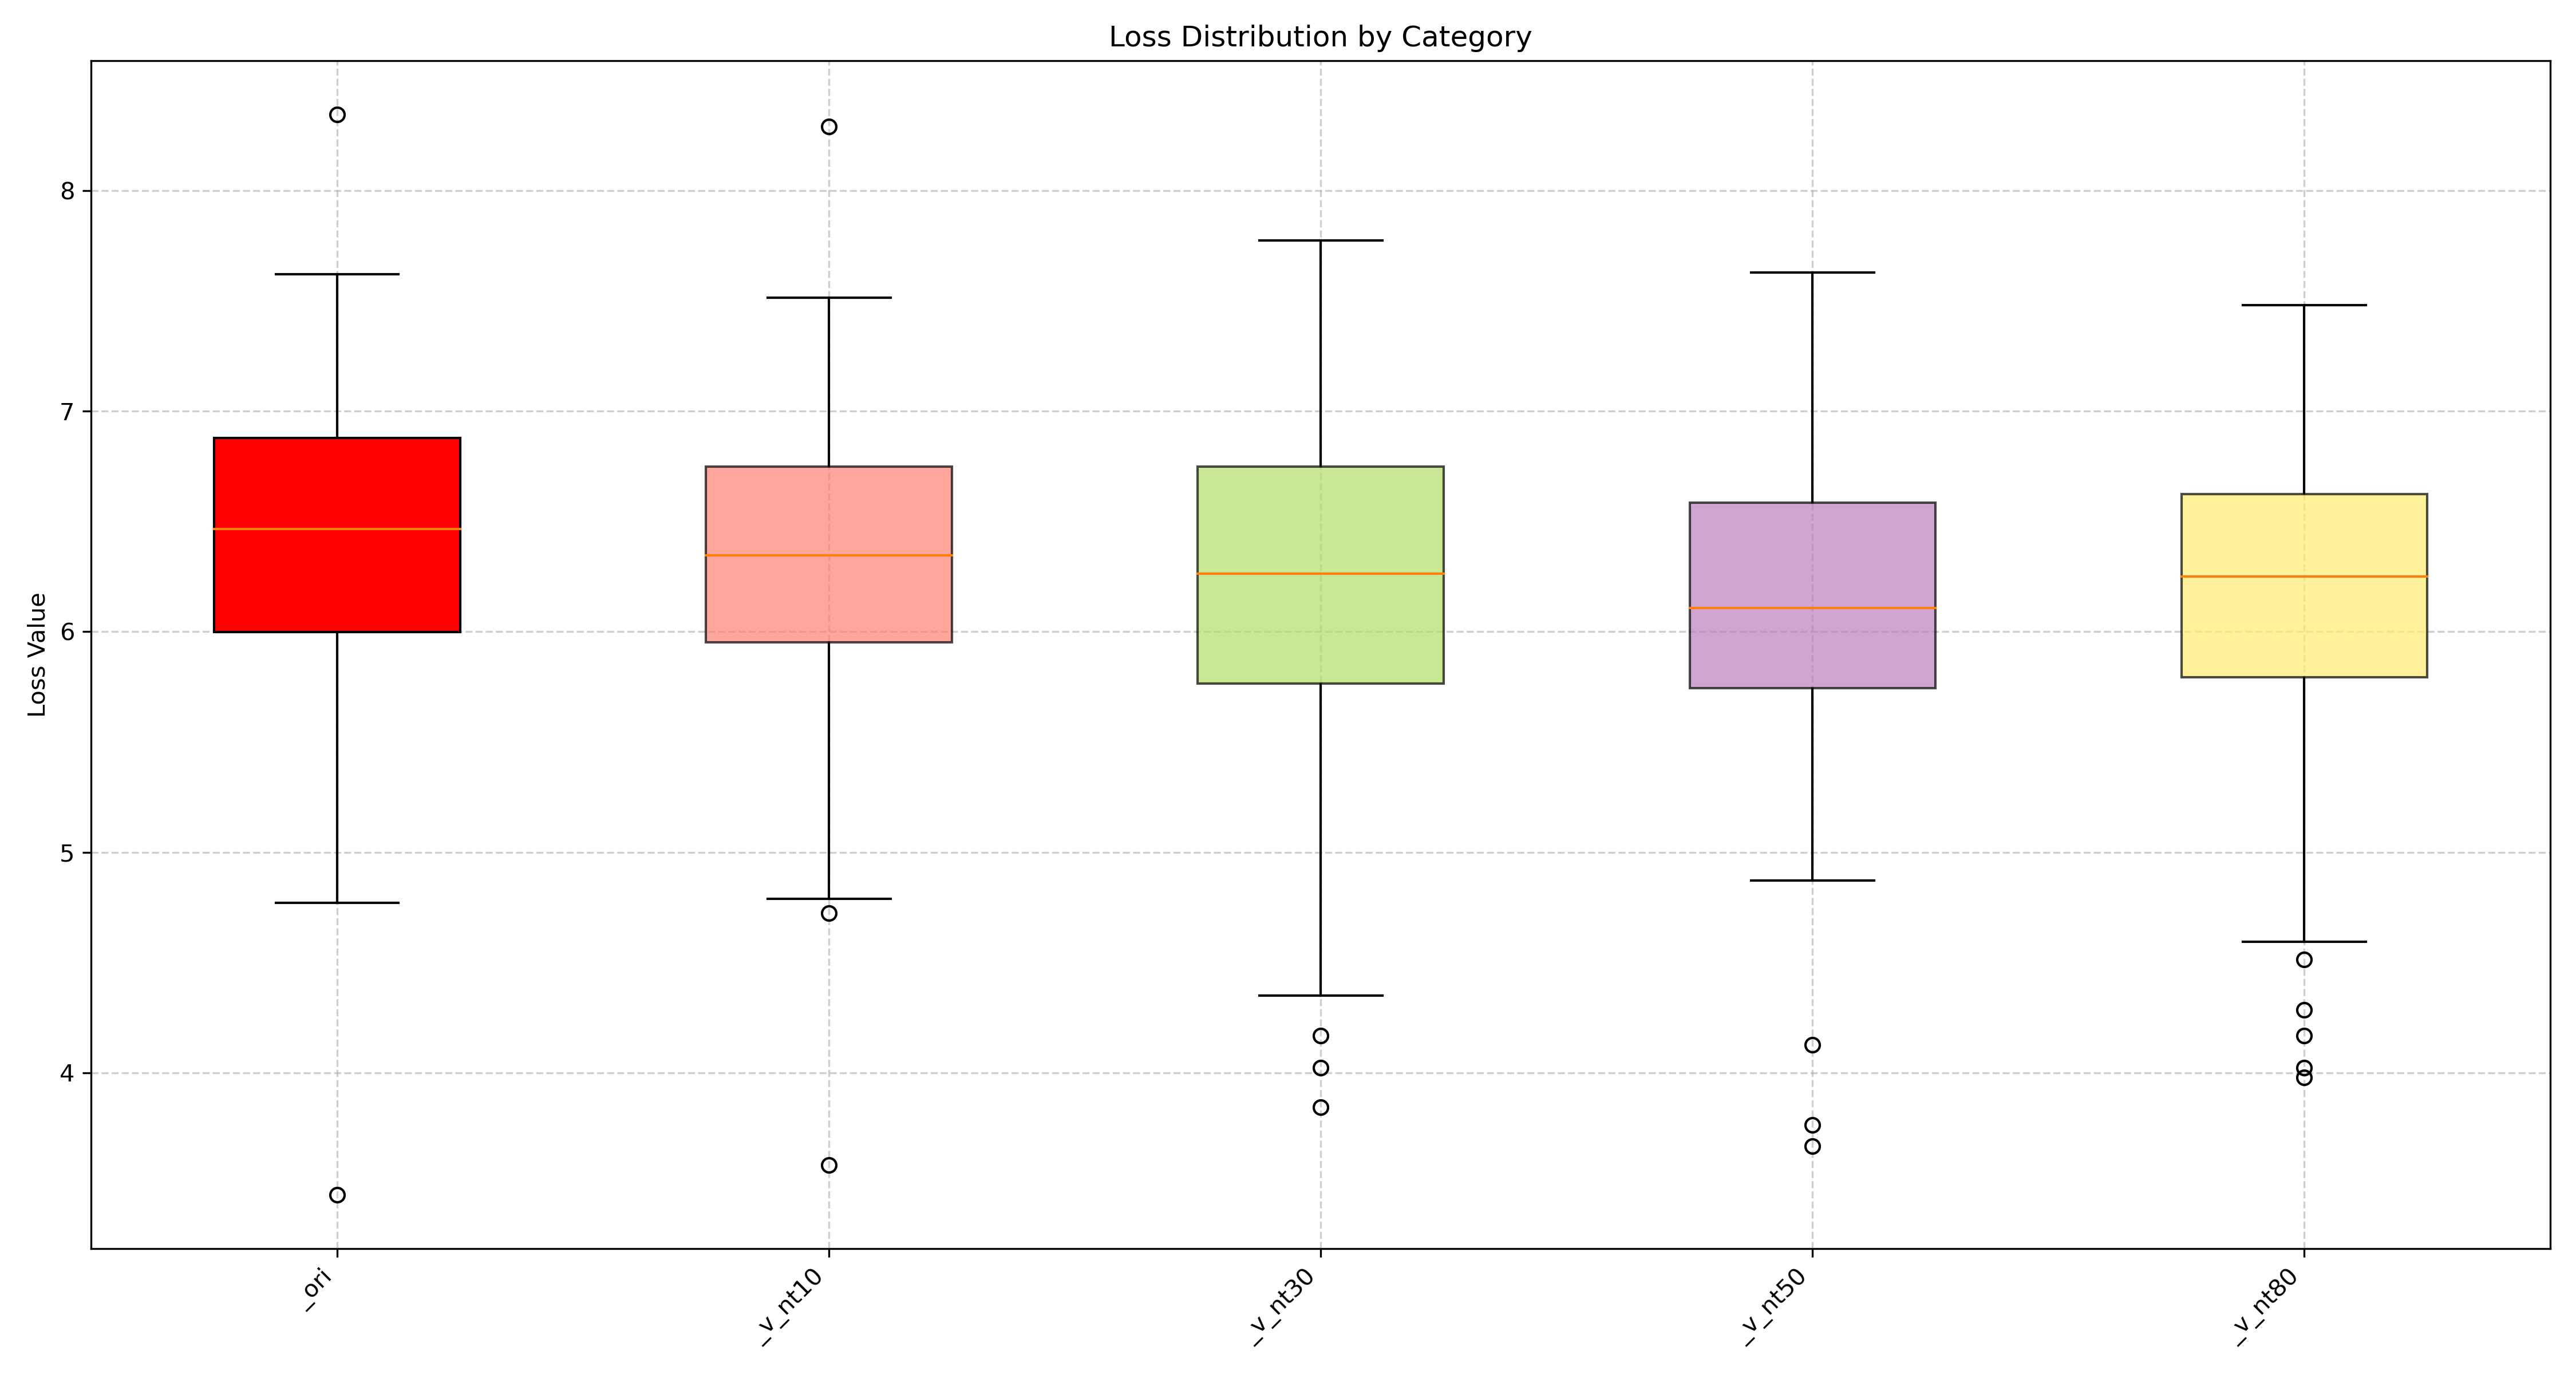
Figure 3-2. Note Velocity Change.
Structure Change
Original (Loss: 6.46)
Structure changed for 80 percents of the original music. (Loss: 6.09)
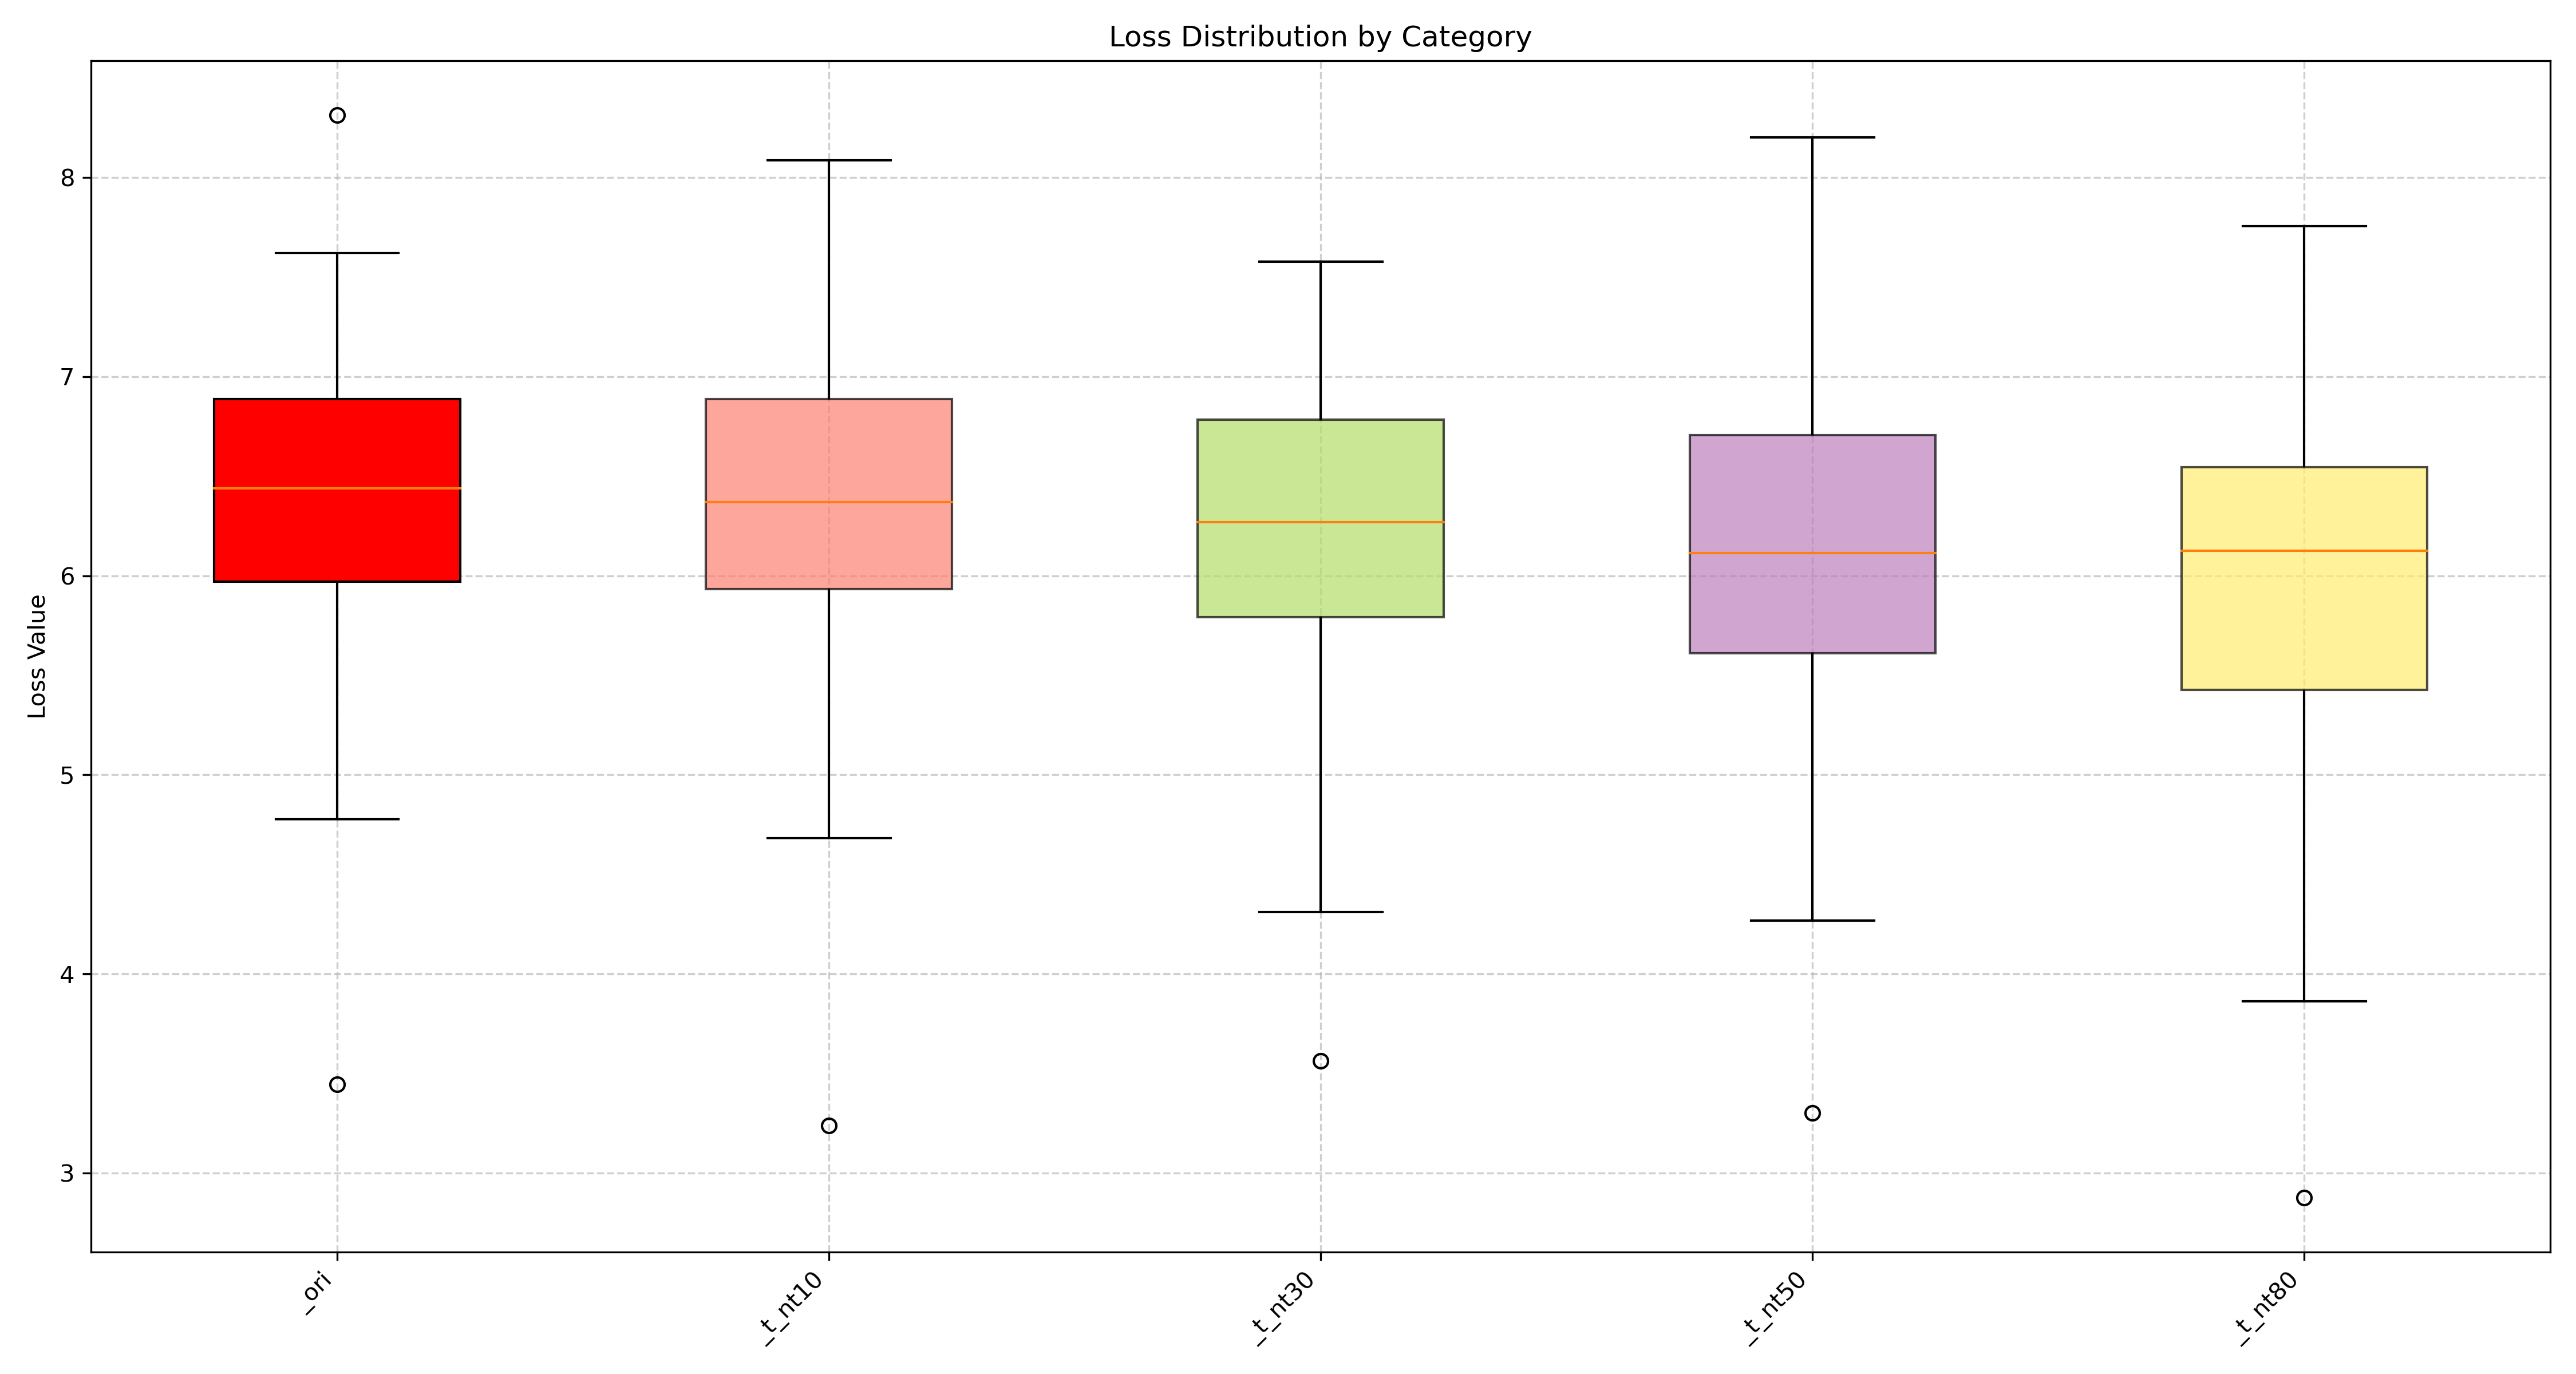
Figure 3-3. Structure Change.